
Figure 5.
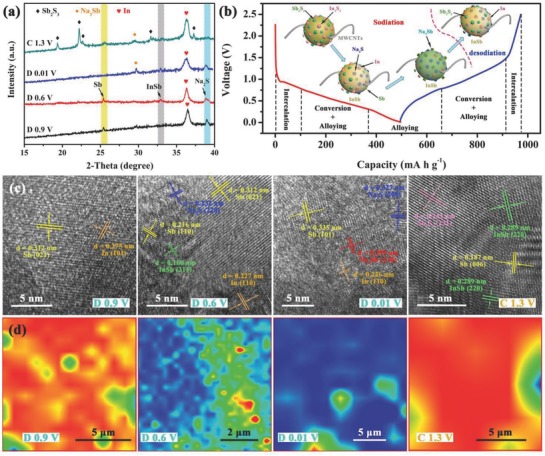
Ex situ measurements for I–S electrode during the charging–discharging process: a) Ex situ XRD patterns captured at different potentials. b) Charging–discharging profiles of the third cycle at 100 mA g−1, insets are structure evolution illustration of I–S. c) Ex situ TEM and corresponding HRTEM images, insets in HRTEM images are relative FFT patterns. d) Ex situ Raman mapping of I–S electrode.