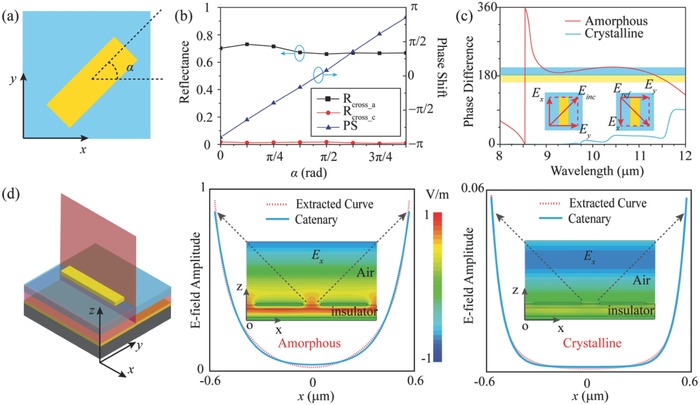
Figure 3.

a) Top view of the unit cell with an orientation angle of α. b) Simulated cross‐polarization reflectance and phase shift as a function of α in two states. c) The calculated phase difference between the two orthogonal polarizations in two states. d) 3D view of the unit cell and the electric field distributions in the red cut plane. The right two panels show the extracted electric field amplitude (red dotted line) and fitted catenary curve (blue solid line) between two adjacent patches for amorphous state (left) and crystalline state (right) at 9.6 µm, respectively. The insets are the distributions of electric field E x in the unit cell under the illumination of LCP.
