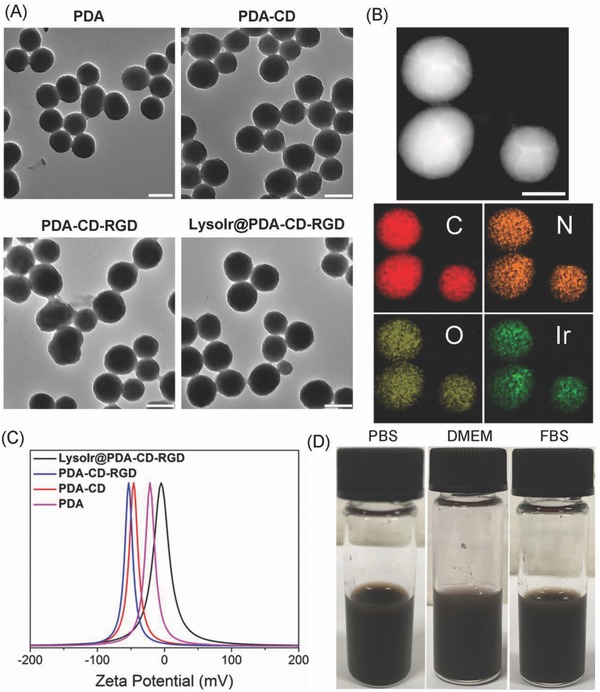
Figure 1.

A) TEM images of PDA, PDA‐CD, PDA‐CD‐RGD, and LysoIr@PDA‐CD‐RGD. Scale bar: 200 nm. B) TEM image and EDS elemental maps of LysoIr@PDA‐CD‐RGD. Scale bar: 100 nm. C) Zeta potentials of PDA, PDA‐CD, PDA‐CD‐RGD, and LysoIr@PDA‐CD‐RGD. D) The images of LysoIr@PDA‐CD‐RGD dissolved in PBS, DMEM, and FBS.
