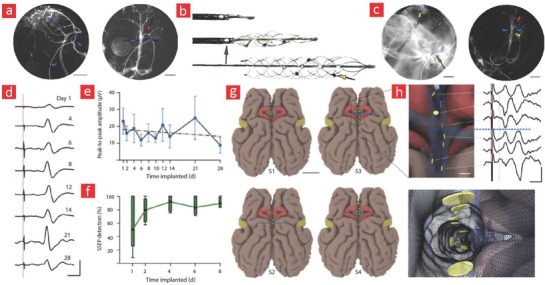
Figure 11.

Engineering of an intracranial stent‐electrode (stentrode) array for recording brain activity. a) Preimplant Images showing the presence of intracranial lumens (blue arrow) and cortical veins (red arrow). b) Images showing the self‐expanding property of the stentrode. c) The integration of the stentrode within blood vessels of a sheep brain. The yellow arrows correspond to the electrodes, while the green arrows correspond to the delivery cathers. d,e) The stentrode was able to record high‐fidelity signals following the implantation. The recorded peak‐to‐peak amplitude was fairly stable for up to 28 days. f) Recordings of somatosensory evoked potential (SSEP). g) The position of the implanted stentrode in four different sheep models. h) A 3D representation of an implanted stentrode and its corresponding peak‐to‐peak amplitude recording. Adapted with permission.391 Copyright 2016, Macmillan Publishers Ltd.
