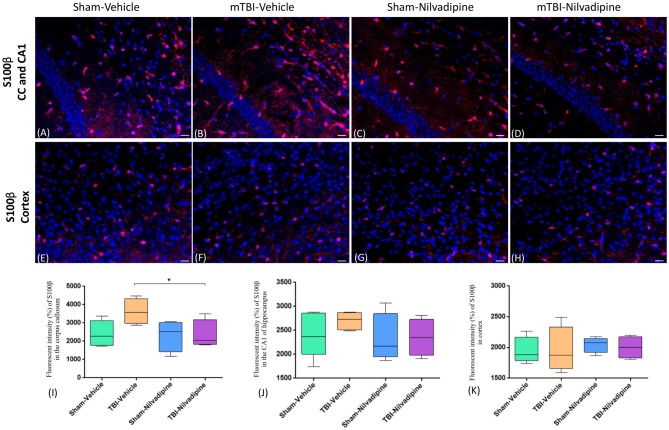
Figure 5.
Fluorescent IHC analysis of S100β (red) in the CA1 are of hippocampus, CC and cortex. (A–D) Representative images of the S100β staining in CC in different treatment groups show an increased area of S100β immunoreactivity after r-mTBI (p > 0.05) which was reduced by Nilvadipine (p < 0.05). In the CA1, no difference between groups was observed (p > 0.05). (E–H) r-mTBI caused no effect on S100β intensity in cortex (p > 0.05). Scale bars equal 50 μm. Data are presented as mean ± standard error of the mean; significance is calculated using one-way ANOVA. (I–K) Quantitative analysis of the fluorescent intensity of S100β shows a Nilvadipine-dependant decrease of astrogliosis in the corpus callosum (p < 0.05) but not in the hippocampus and cortex. *p < 0.5.

