Figure 2.

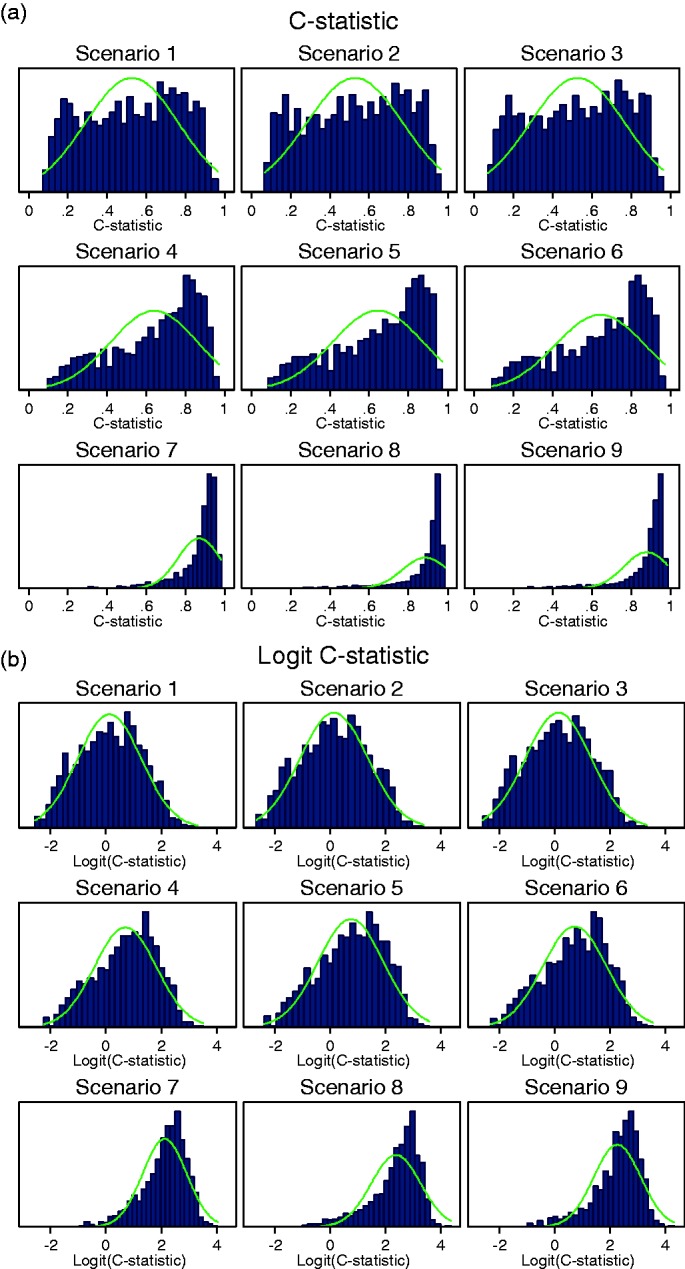
Histograms for (a) the C-statistic and (b) logit C-statistic when there is large variability in the predictor effect βj (setting 7: σβ = 0.07).

Histograms for (a) the C-statistic and (b) logit C-statistic when there is large variability in the predictor effect βj (setting 7: σβ = 0.07).