Fig. 4.
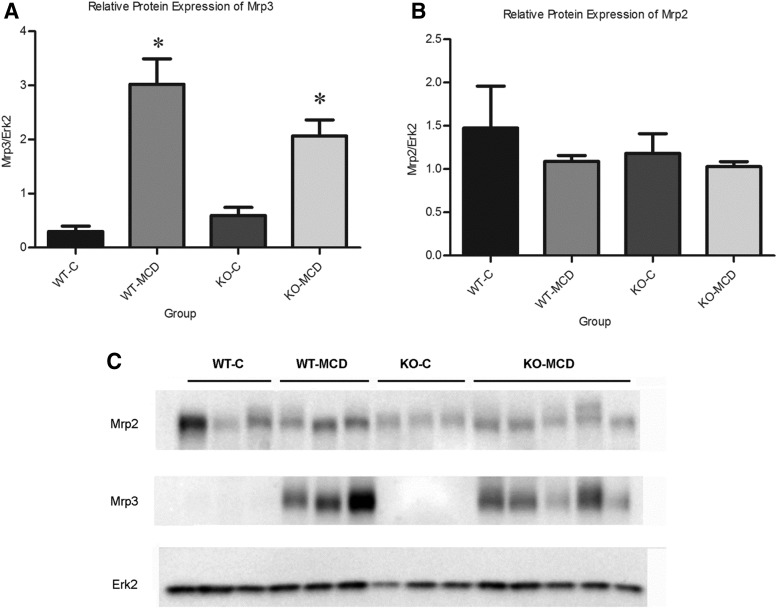
Alterations of Mrp2 and Mrp3 protein expression in MCD diet. Relative protein expression of (A) Mrp2 and (B) Mrp3 between control and MCD groups. (C) Relative protein expression was determined by immunoblot analysis. Graphs represent mean ± S.D. Two-way analysis of variance, *P ≤ 0.05, n = 3, n = 4 (KO-MCD).

