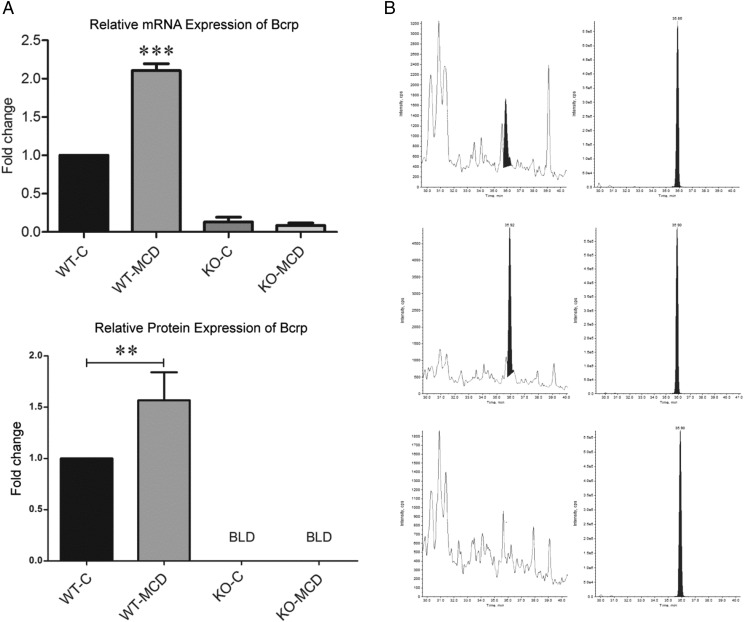
Fig. 6.
Alterations of Bcrp protein and mRNA expression during MCD diet. (A) mRNA expression was determined by quantitative reverse-transcription PCR analysis, and fold change was determined using the δ-δ CT method. Protein expression was determined by proteomic analysis using LC-MS/MS. Graphs represent mean ± S.D. Two-way analysis of variance, *P ≤ 0.05; **P ≤ 0.01, ***P ≤ 0.001, n = 3, n = 4 (KO-MCD). (B) Representative chromatograms of WT-Control, WT-MCD, and KO groups. Left chromatogram depicts native protein concentration, and right chromatogram depicts internal standard peptide.

