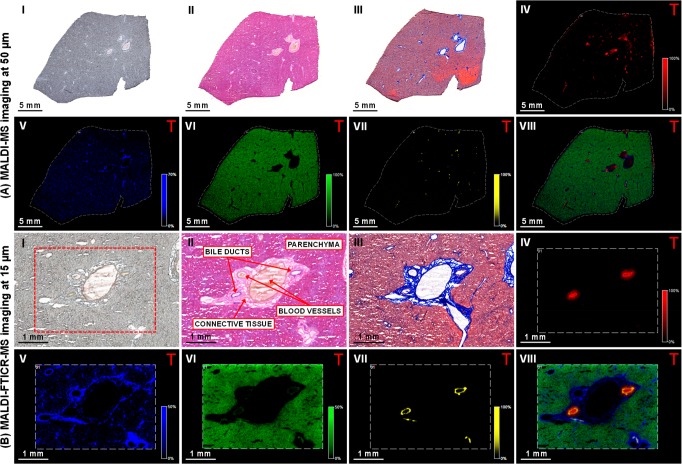
Figure 1.
Multimodal imaging of healthy dog liver tissue. (I) Optical image of the tissue section prior to matrix application or staining. (II) Tissue sections stained with hematoxylin and eosin stain, and (III) Masson’s trichrome. Negative-ion mode (A) MALDI-MS and (B) MALDI-FTICR-MS images showing the distribution of selected molecular species in the (IV) bile duct lumen ([TCA – H]− at m/z 514.2849); (V) connective tissue ([PA (18:0_18:1) – H]− at m/z 701.5129); (VI) parenchyma ([PI (18:0_20:4) – H]− at m/z 885.5504); (VII) bile duct ([ST–OH (18:1_24:0) – H]− at m/z 906.6339); and (VIII) overlay of the selected species. (Designated masses are from MALDI-FTICR-MS imaging measurements, MALDI-MS image field of view 140785 pixels, area 124 mm2, and spatial resolution 50 μm. MALDI-FTICR-MS image field of view 51761 pixels, 11.6 mm2 area, and spatial resolution 15 μm. Images normalized with TIC).

