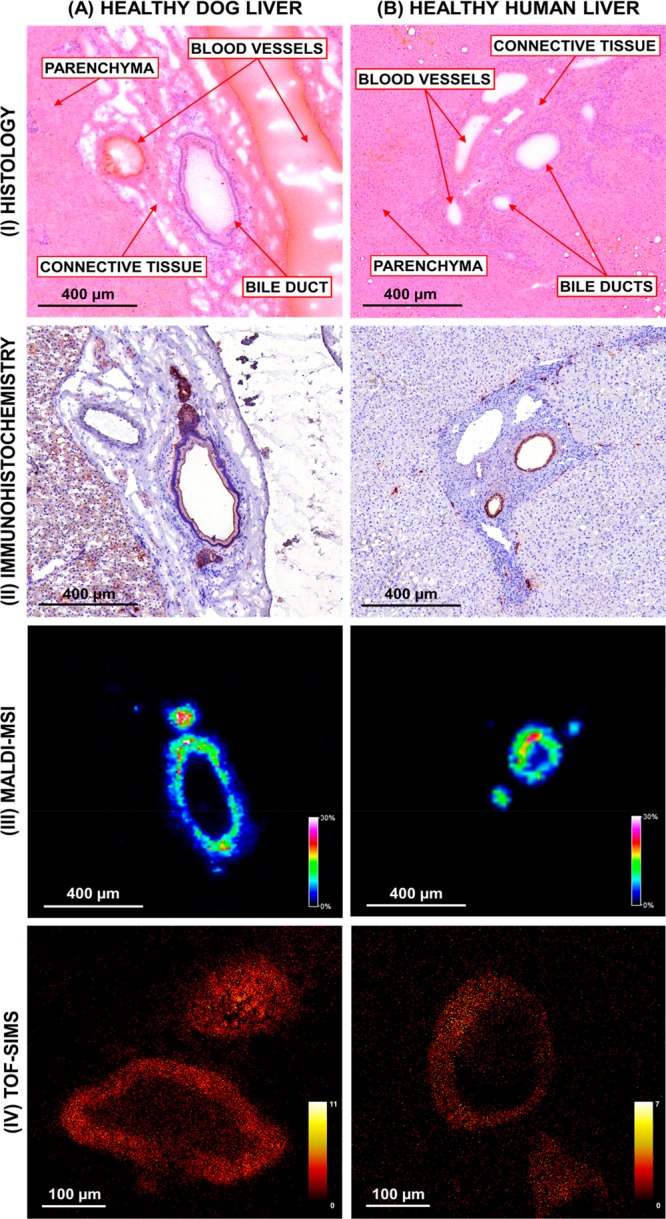
Figure 3.

Comparison of immunohistochemical staining, MALDI-MS imaging and TOF-SIMS imaging of (A) healthy human and (B) dog liver. (I) Hematoxylin and eosin stain of tissue section post-MALDI-MSI analysis. (II) Cytokeratin staining shows the bile duct epithelium. Negative-ion mode (III) MALDI-MS imaging and (IV) TOF-SIMS imaging of the bile ducts showing the distribution of [ST–OH (18:1_24:0) – H]− at m/z 906.63. (MALDI-MS image (dog) field of view 15875 pixels, area 1.60 mm2, and spatial resolution 10 μm. MALDI-MS image (human) field of view 30420 pixels, area 3.05 mm2, and spatial resolution 10 μm. TOF-SIMS (dog/human) field of view 250000 pixels, area 0.25 mm2, and spatial resolution 1 μm. Images normalized with TIC).
