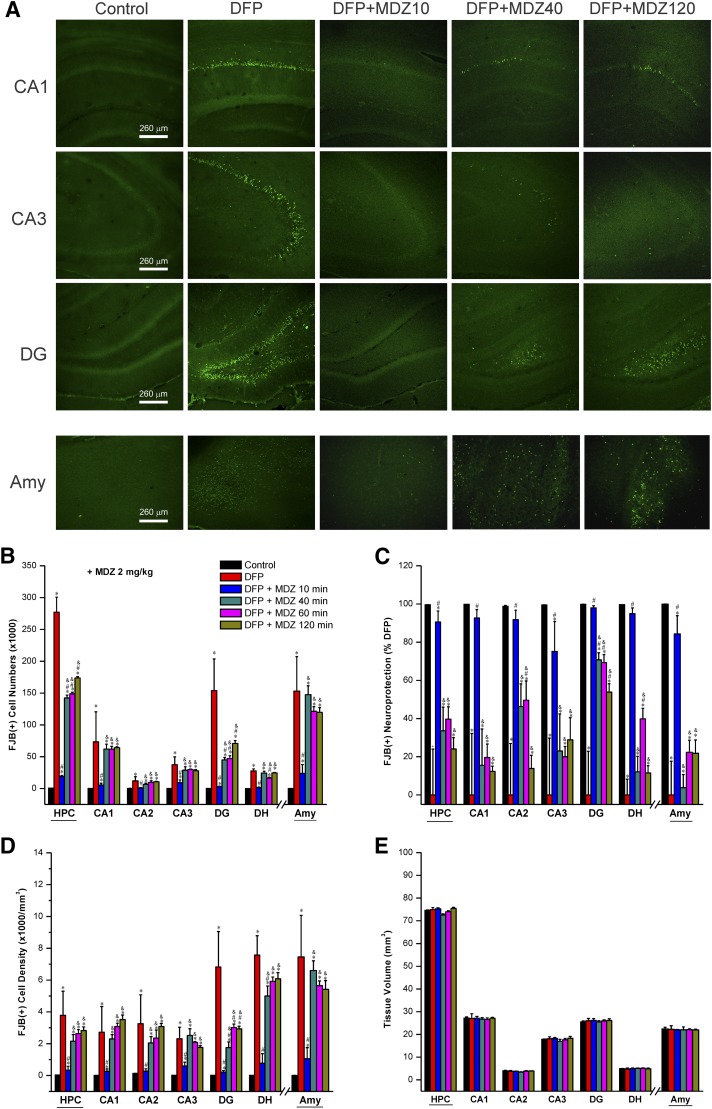
Fig. 4.
Time-course protective profile of midazolam (2 mg/kg) on DFP-induced neuronal injury in the hippocampus (HPC) subfields and amygdala (AMY) at 3 days after DFP exposure. (A) Representative fluoro-Jade B (FJB+) staining depicting dying neurons in brain sections from animals treated with midazolam at 10–120 minutes after DFP exposure. (B) The bar charts depict FJB(+) neuronal counts by stereology in hippocampus subfields and amygdala. (C) Normalized percentage of neuroprotection by midazolam with reference to FJB(+) cells in DFP group. Normalized neuroprotection was calculated using the untreated DFP-exposed group as the baseline (0% protection). In this estimate, the control group not exposed to DFP was rated as 100% protected because of lack of any FJB(+) cells in any region. All midazolam-treated DFP-exposed rats exhibited <100% protection. (D) FJB(+) cell density by stereology in hippocampal subfields and amygdala. (E) Brain slice thickness/volume in DFP alone and DFP + midazolam groups. Control sections (no DFP cohort) showed no FJB(+) cells. Each bar represents the mean ± S.E.M. (n = 4–11 per group). *P < 0.05 versus control (no DFP); #P < 0.05 versus DFP alone group; &P < 0.05 versus DFP + MDZ 10-minute group (two-way repeated measures analysis of variance and post hoc Tukey’s honestly significant difference test).

