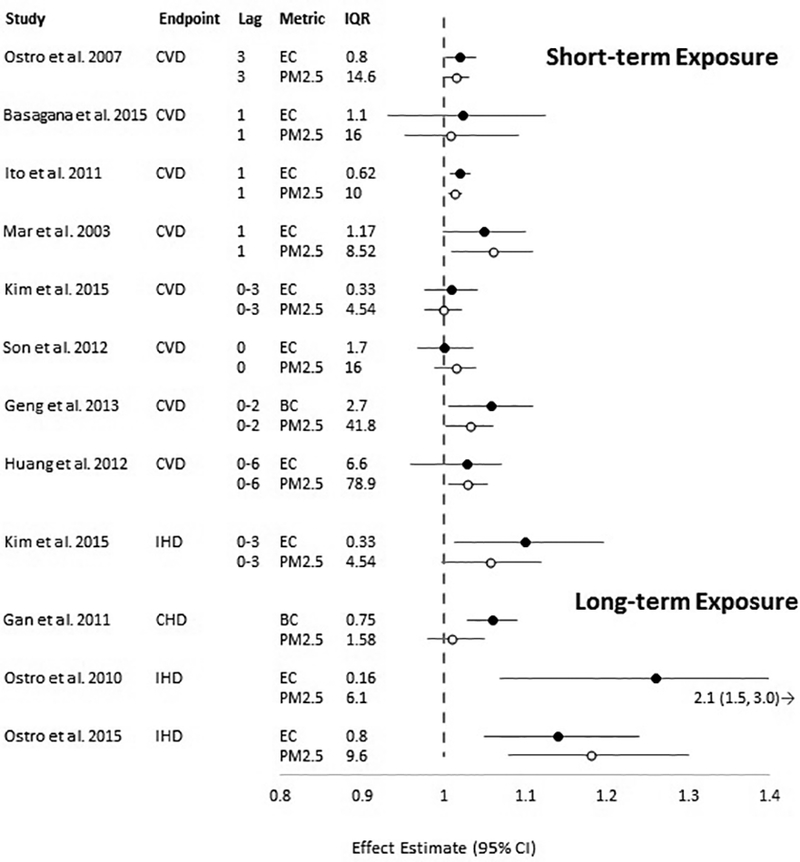
Figure 4.

Association between exposure to BC or EC and PM2.5 and cardiovascular mortality per interquartile range (IQR) in mean (or median) pollutant concentration (in μg/m3). Circles represent point estimates, horizontal lines represent 95% confidence intervals for BC or EC (black circles) and PM2.5 (white circles) per increase in concentration equal to the IQR as reported in the study. CVD: mortality due to any cardiovascular disease; IHD: ischemic heart disease; CHD: coronary heart disease. (Black and White Figure)
