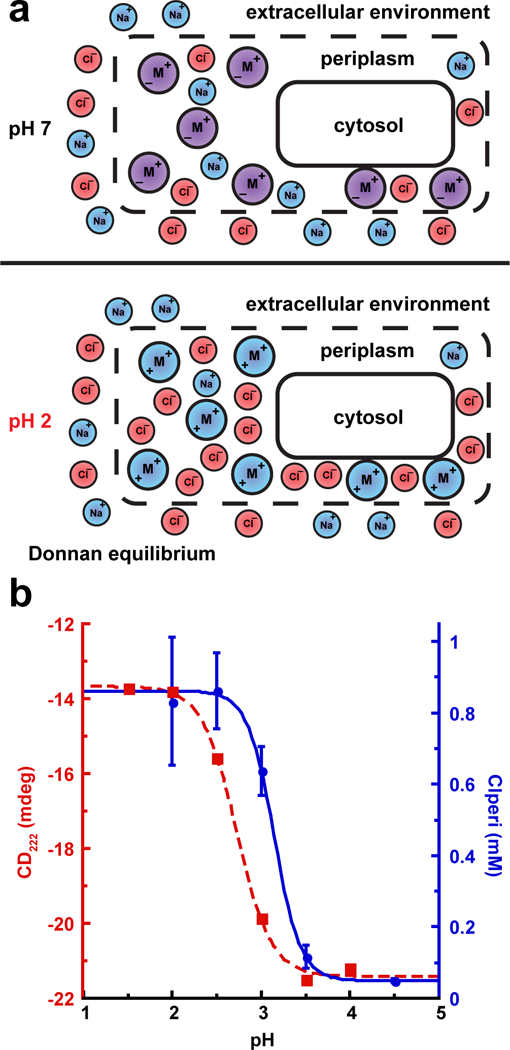
Figure 3. Acid Exposure Results in an Accumulation of Chloride Within the Periplasm Due to a Donnan Equilibrium.

(a) Top: at neutral pH, the macromolecules (denoted as purple M circles) inside the periplasm contain a roughly even distribution of positively and negatively charged functional groups. At this pH, the concentration of sodium and chloride ions within the periplasm should be similar to that of the extracellular environment. Bottom: acid exposure protonates the acidic functional groups on the macromolecules. As a result, the macromolecules inside the periplasm only contain positive charges (denoted as blue M circles). The high density of positively charged macromolecules at low pH results in a Donnan equilibrium across the outer membrane, and chloride ions accumulate inside the periplasm above the extracellular concentration in order to maintain electroneutrality.
(b) The red squares show the secondary structure measured by circular dichroism of bulk proteins from periplasmic extracts as a function of pH. The blue circles show the measured Clperi values for the data in citrate buffer from Supplementary Table 1. The apparent pKa from fitting the pH dependent data was 2.7 ± 0.1 and 3.1 ± 0.1 for the CD and Clperi data, respectively. Values reported are the mean ± s.e.m. of the fit. n=3 independent samples and the error bars represent the mean ± s.d. for the Clperi measurements. Error bars for the CD data are too small to be visualized at this scale.
