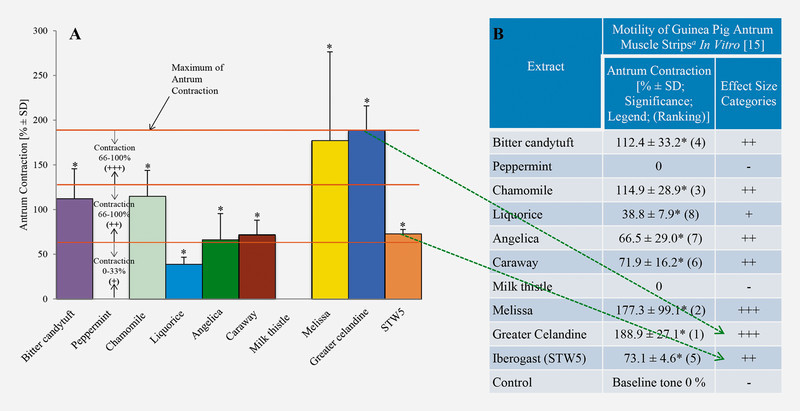
Fig. 1.

Example for data analysis and categorization of pharmacological results. A Standardized categorization of effect size of STW 5 and its single components on contraction of guinea pig antrum muscle strips in vitro compared with control. Shown are results on increased circular and longitudinal muscle contraction by STW 5 and its single constituents compared with control (0%) measured in percent (%) including standard deviation (SD), as well as level of significance (*). Starting from definition of upper boundary, in this case “maximum antrum contraction” induced by greater celandine (189% corresponding to 100% effect size) and lower boundary of effect size, (0% of control), three effect size categories are defined for the extent of contraction. Effect sizes of 0 – 33% are defined as category “+”, of 33 – 66% as category “++”, and of 66 – 100% as category “+++”. Effect size categories are then transferred into the summary tabulation ( B ) as shown for greater celandine and STW 5 (green arrows). B Summary tabulation of data resulting from a single pharmacological test system for STW 5 and its single constituents as well as corresponding effect size categories. Data shown comprise a list of extracts and results from the in vitro measurements of the variable “circular and longitudinal antrum muscle contraction”. Effect size was measured in percent (%) increase of muscle contraction compared to control (0%). Additionally, SD, significance (*p ≤ 0.05), references to legends, ranking of results for single extracts and STW 5 (numbers in brackets), and dose information for all extracts and STW 5 are given.
