Fig. 4.
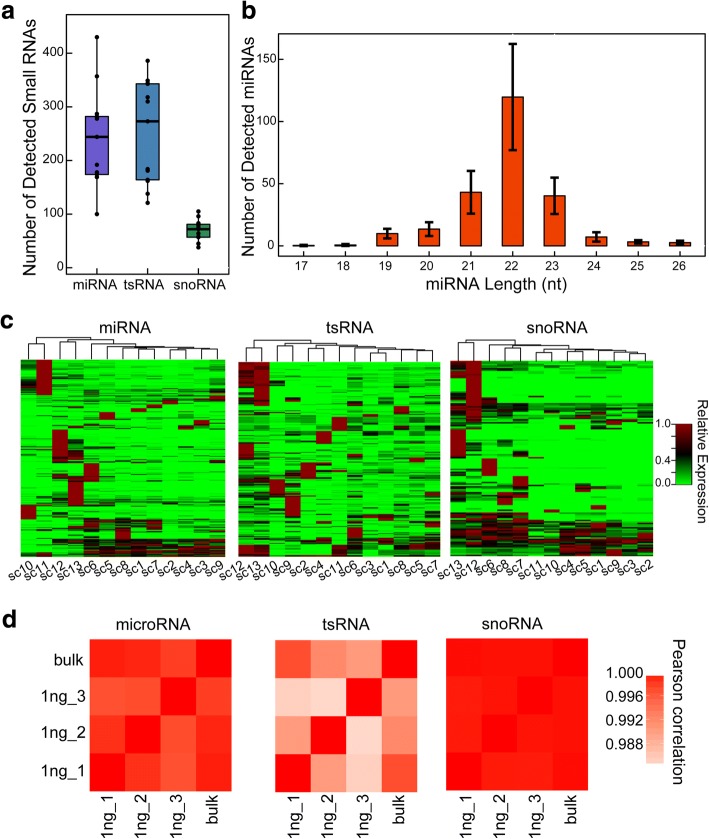
The characterization of small RNAs transcriptome by Holo-Seq. a Number of miRNAs, tsRNAs and snoRNAs detected in mESC single cells. b Size distribution of miRNAs profiled from mESC single cells. Error bars indicate the Standard Deviation (SD). c Heat map of the relative expression levels of miRNAs, tsRNAs and snoRNAs profiled from 13 mESC single cells. d Pearson correlation heat maps of miRNAs, tsRNAs, and snoRNAs abundance profiled from ZHBTc4 cells (bulk small-RNA-Seq) and 1 ng ZHBTc4 total RNAs (Holo-Seq)

