Figure 4.

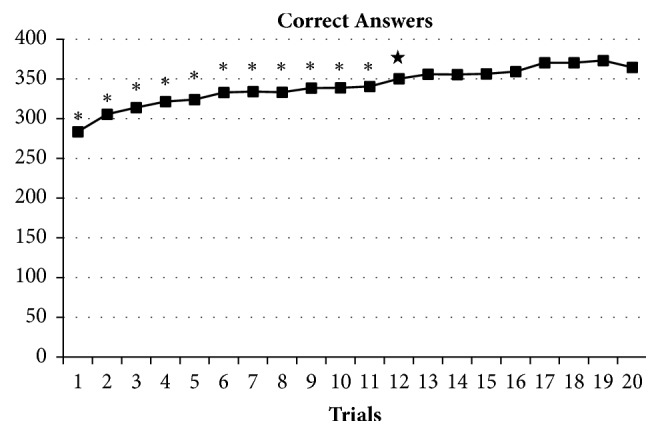
Mean number of correct answers in the calculation task up to the trial 20. ∗P < 0.05 versus the trial 20, ★P < 0.05 versus the mean of trials 16 – 20.

Mean number of correct answers in the calculation task up to the trial 20. ∗P < 0.05 versus the trial 20, ★P < 0.05 versus the mean of trials 16 – 20.