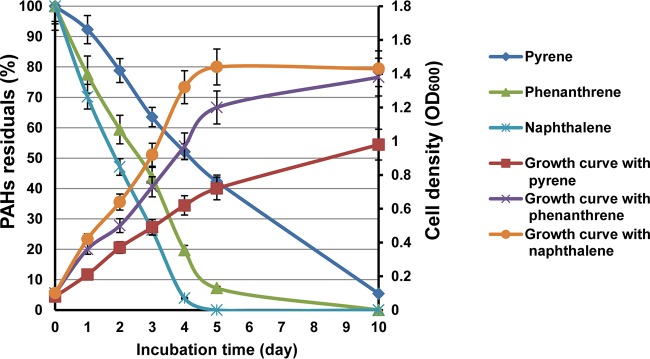
FIG 1.
PAH degradation efficiency and growth of Cycloclasticus sp. P1 with several PAHs as the sole carbon source. The left axis shows PAH degradation efficiency as the residual PAH percentage after growth. The right axis shows cell density (OD600) under optimal growth conditions of 28°C, 3.0% salinity, and pH of 7.0. Vertical bars represent means ± standard deviations (SDs) of results from triplicate treatments.

