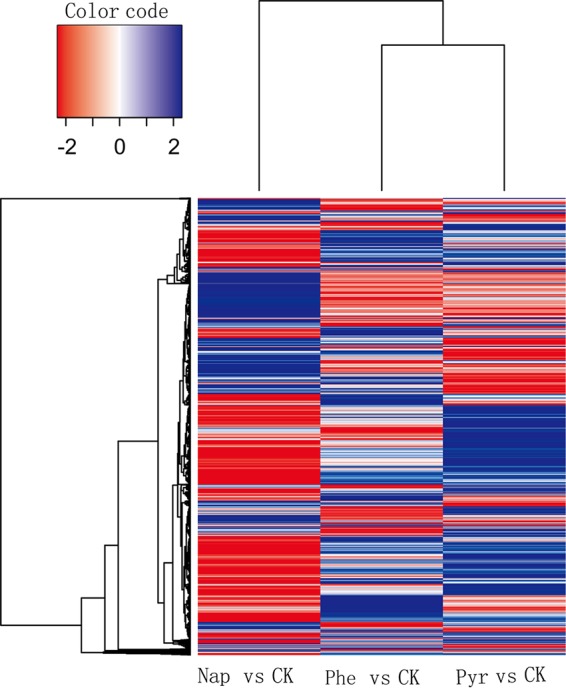
FIG 2.

Heat map showing transcriptomic features of Cycloclasticus sp. P1 grown with three different PAHs. Blue indicates upregulated genes, and red indicates downregulated genes. Columns represent different PAH treatment groups, and rows represent different genes. Changes in the PAH treatment groups are shown for genes with significantly different expression levels under PAH treatments compared to those of the control (CK) and includes genes within treatments that were not significantly different from those of the control. Nap, naphthalene; Phe, phenanthrene; Pyr, pyrene; CK, control group (non-PAH treatment).
