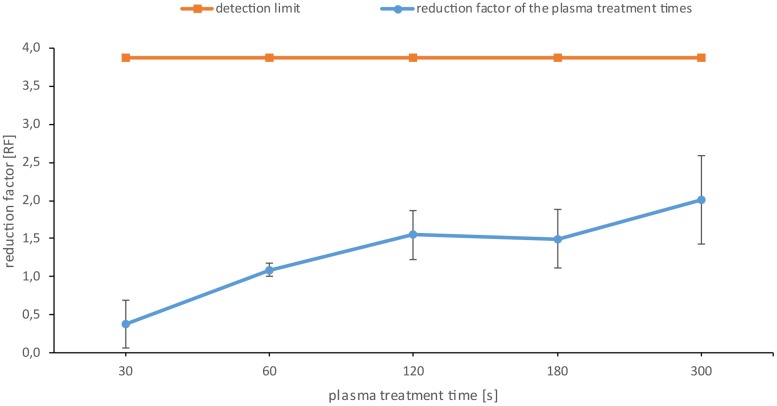
FIG 5.
CFU assay of the Candida albicans biofilms after plasma treatment. The orange line represents the detection limit up to which representative values could be counted. The blue line shows the reduction factor (RF) of the different plasma treatment times. The error bars were calculated using the propagation of error and weighted error for the controls and the weighted mean value for the samples. The data points are the weighted mean values for the total population of the quadruple repetition. n = 6 for each repetition. P < 0.05.

