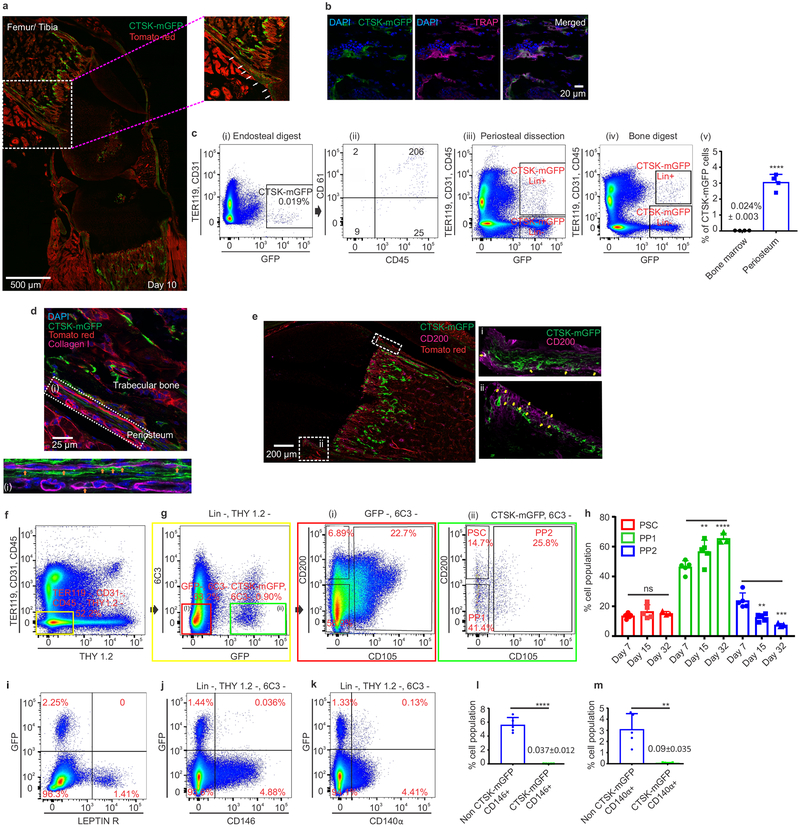
Figure 1: Cathepsin K-cre labels periosteal mesenchymal cells.
a, mGFP (green) signal in femur of Ctsk-cre; mTmG mice at postnatal day 10 (P10). Scale bar 500μm. Enlarged view of dotted white box. b, Endosteal CTSK-mGFP+ cells express the osteoclast marker TRAP (magenta). DAPI (blue) for nuclei.). a, b 5 independent experiments. c, Distribution of CTSK-mGFP cells in the endosteal digest (i, ii), periosteum (iii) and total bone digests (iv) by FACS. ****p=1.69×10⁻⁵ (v) (mean ± S.D; n=4; 2 tailed Student’s t-test). d-e, A subset of CTSK-mGFP (green) periosteal cells of the femur expresses type 1 Collagen (d, magenta; orange arrow, scale bar 25μm) and a subset expresses CD200 (e, magenta; yellow arrows, scale bar 200μm). DAPI (blue) for nuclei. Enlarged view of e, i-ii is provided in Extended data. 1h. 3 independent experiments. f-g, Flow cytometry of P7 mice to identify periosteal stem cells (PSC) and progenitor cells (PP1, PP2) in long bones. Color coded boxes (yellow, red, green) indicate parent/daughter gates. h, % of PSC, PP1 and PP2 populations over time in long bone digests. For PP1, **p = 0.0063 at day 15, ****p=0.0001 at day 32. PP2, **p = 0.0022 at day 15, ***p =0.0001 at day 32. One way ANOVA, Sidak’s multiple comparison test; mean ± S.D; n=5 for days 7 and 15, n=3 for day 32, representative of 3 independent experiments. i-k, Flow cytometry for LEPR (i), CD146 (j) and CD140α (k) versus CTSK-mGFP in long bones. 5 independent experiments. l-m, CTSK-mGFP cells display significantly fewer CD146+ (****p=0.0000029) and CD140α+ (**p= 0.0014) cells than non-CTSK mGFP cells (mean ± S.D; 3 independent experiments; 2-tailed Student’s t-test).

