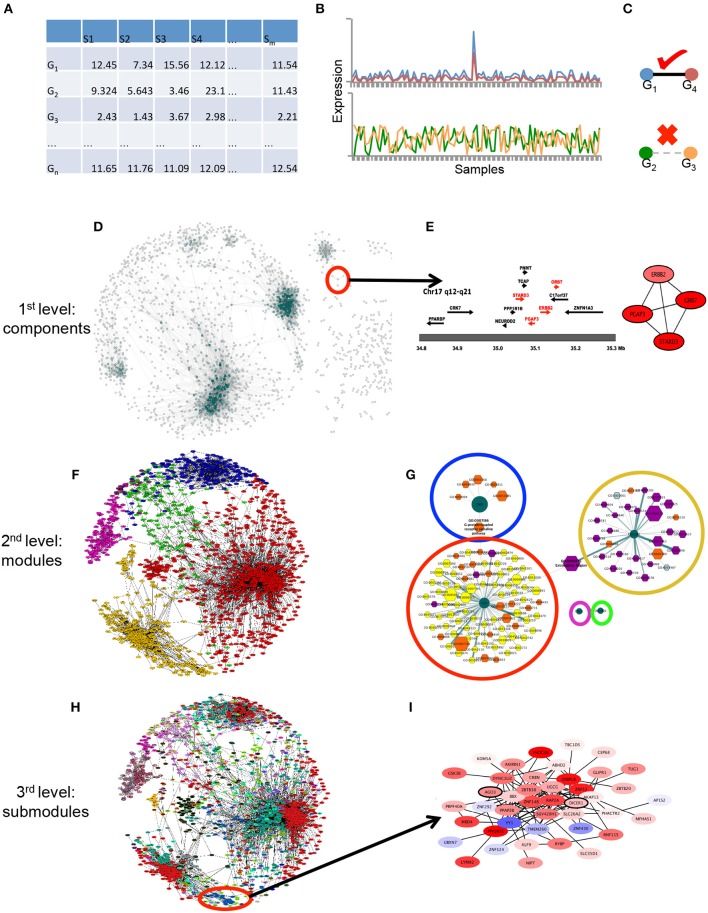
Figure 1.
Graphical pipeline. (A) Data acquisition: The gene expression matrix (samples in columns, genes in rows) is generated with HER2+ samples from the datasets used in de Anda-Jáuregui et al. (2015). (B) Gene-gene relationships: By means of mutual information between couples of genes in (A), gene expression across all samples are correlated. (C) High correlations are considered if they pass a certain threshold value (in this case the top 10,000 interactions). (D) First level of modularity: connected components. The largest level of modularity in this network is associated to certain structures, shown in (E), the amplicon in Chr17 is depicted there. (F) Second level of modularity: Infomap-derived communities. In different colors, the modules generated by the infomap algorithm are depicted. (G) The aforementioned modules are enriched with Gene Ontology categories, which apparently represent specific categories (orange, violet and yellow nodes) per module (dark green centered nodes). (H) Third level of modularity: Hierarchical map equation. In different colorsthe modules obtained in (F) are systematically separated into submodules, and these are again enriched, as observed in (I).

