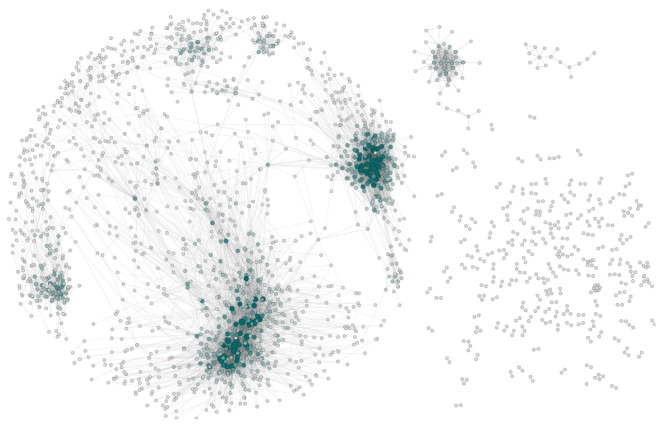
Figure 2.
The network architecture of Her2+ breast cancer. The visualization shows the connected components (islands) of this network separately. In this representation nodes are colored and sized according to their node degree (i.e., the number of neighbors connected to a gene). The layout and arrangement of the network showcases the giant component (Left) and several small islands (Right).

