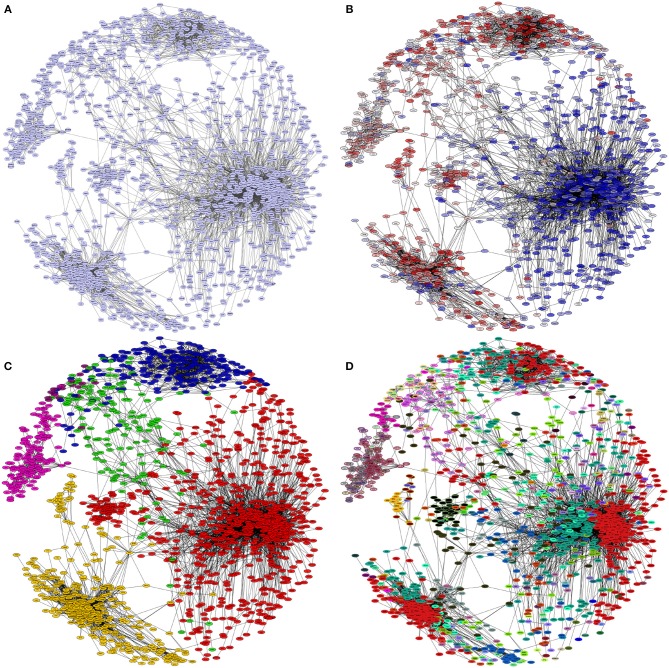
Figure 3.
Hierarchical levels of modularity in the HER2+ network. In each panel, the giant component of the HER2+ breast cancer network is depicted. The colors of the nodes in each panel represent different groupings: (A) all nodes are colored the same, as they belong to the same connected component. (B) Nodes are colored by expression levels (blue: underexpressed, red: overexpressed) regardless of connectivity patterns. Notice that genes are grouped together depending on the differential expression pattern. (C) Nodes are colored according to modules detected by Infomap; in (D) nodes are colored by submodules inside the modules, these submodules were detected using the hierarchical map equation.

