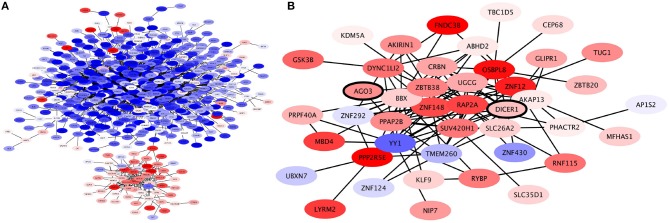
Figure 6.
Expression profile of CNR2 Community. (A) This community is roughly divided in two based on expression levels: the genes in the communities depicted on the upper side of the network are underexpressed (blue); these are genes involved in plasma-membrane associated processes. Meanwhile, the genes in the community depicted at the bottom are overexpressed; these are genes involved in intracellular signaling. (B) Expression profile of ZBTB38 Submodule of CNR2 module. Genes in this module are mostly overexpressed. Two of the genes in this submodule are DICER and AGO3, crucial elements of micro-RNA regulation (bold).

