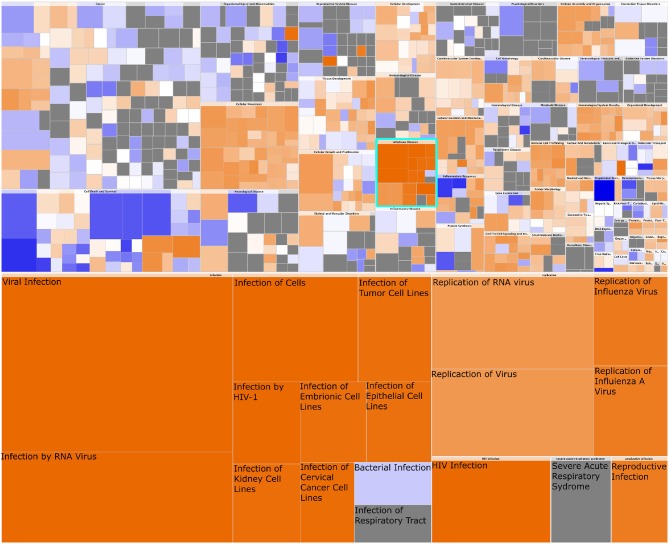
Figure 9.
Heatmap of Diseases and Functions associated with HER2+ breast cancer. In this figure we observe the whole set of Diseases and Functions associated with the gene expression signature of HER2+ breast cancer. The heatmap in the upper part represents High-level functional categories: Cancer, Cellular movement, etc. Square color is the z-score of the function, it reflects the direction of change of the function, based on the differential expression of the genes in said function. Orange color represent a positive z-score, which indicates a trend toward an increase. Blue squares represent a decrease. Square size is proportional to the number of genes in said function. In turquoise is delimited the High-level category corresponding to Infectious Disease. This category is zoomed-in at the bottom of the figure. Notice that every process but bacterial infection are consistently increased, and those correspond to viral infection-related processes.

