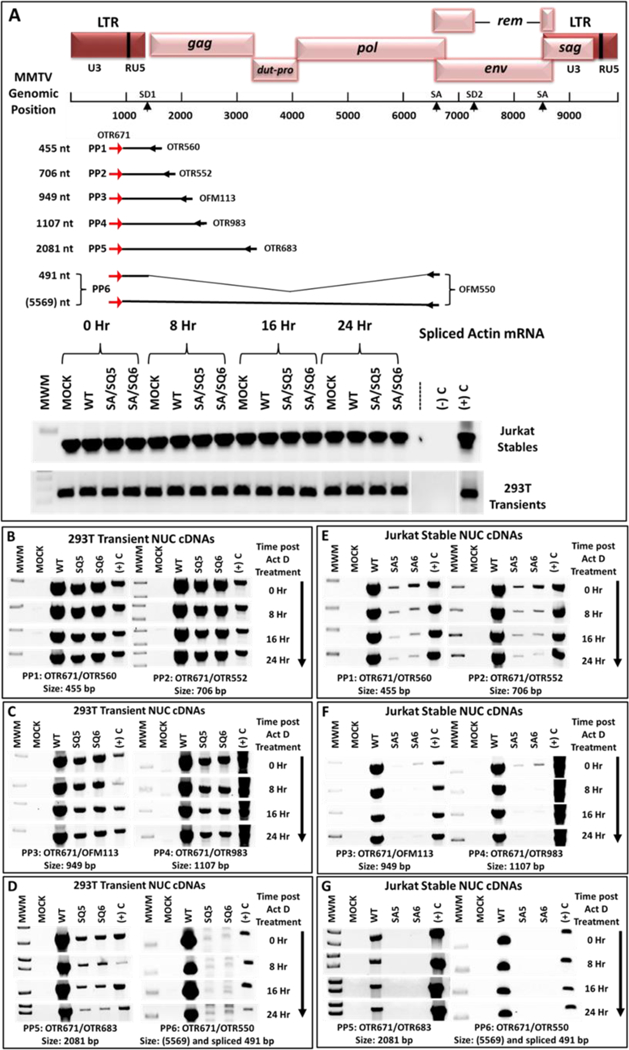
Figure 7: Inability of 5’ UTR mutants to successfully elongate genomic transcripts.

(A) Map of the MMTV genome showing the location and coordinates of the primers used for the transcript elongation analysis. Length of the gRNA transcripts expressed was analyzed using the six primer pairs (PP1-PP6) shown with their product size. The forward primer (OTR671) was common to all the primer pairs with a different reverse primer located progressively downstream from the transcriptional start site. PP6 could amplify both the genomic as well as the spliced mRNAs; however, due to the long length of the gRNA (5569 nt), this mRNA could not be amplified by PP6 under the conditions used. The detected band is the spliced mRNA only. Below the map are the control splice actin mRNA amplifications, showing that the amount of input cDNAs in each lane was equivalent. (B-D) RT-PCR analysis of cDNAs from HEK293T cell lines transiently transfected with MMTV WT or mutant SQ5 and SQ6 clones containing the CMV promoter. (E-G) RT-PCR analysis of cDNAs prepared from stable Jurkat cell lines expressing either the wild type (WT) or mutant SA5 and SA6 clones. Note that the results for length of transcript elongation are different in HEK293T and Jurkat cells. For ease of observation, the inverted images of the gels are presented.
