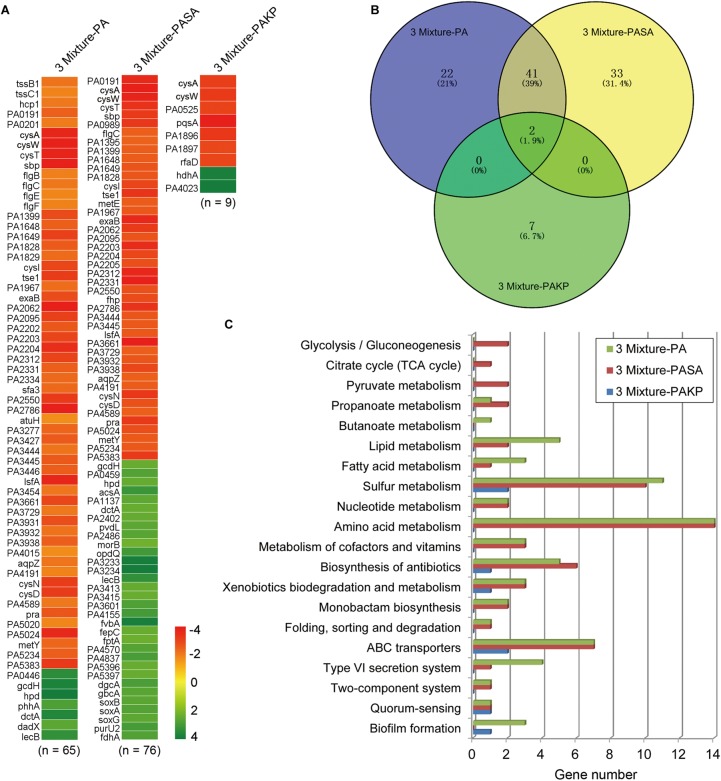
FIGURE 4.
The intracellular transcriptional profile of PA can be influenced by the presence of KP. Different combinations of PA, SA, and KP were repeatedly (24 h intervals) cocultured in M9-PCh broth. Total RNAs of each culture were isolated at day 21. (A) Significantly differentially expressed genes of PA when PA was cultured in different conditions. (B) Statistics of the numbers and (C) KEGG analyses of significantly differentially expressed genes of PA when PA was cultured in different conditions [according to (A) and Supplementary Datasets 2–4] by using VENNY 2.1 and KEGG Mapper. 3 Mixture-PA, coevolution of PA, SA, and KP compared to monoevolution of PA; 3 Mixture-PASA, coevolution of PA, SA, and KP compared to coevolution of PA and SA; 3 Mixture-PAKP, coevolution of PA, SA, and KP compared to coevolution of PA and KP. “n” indicates the number of genes. Data shown are FDR < 0.05.

