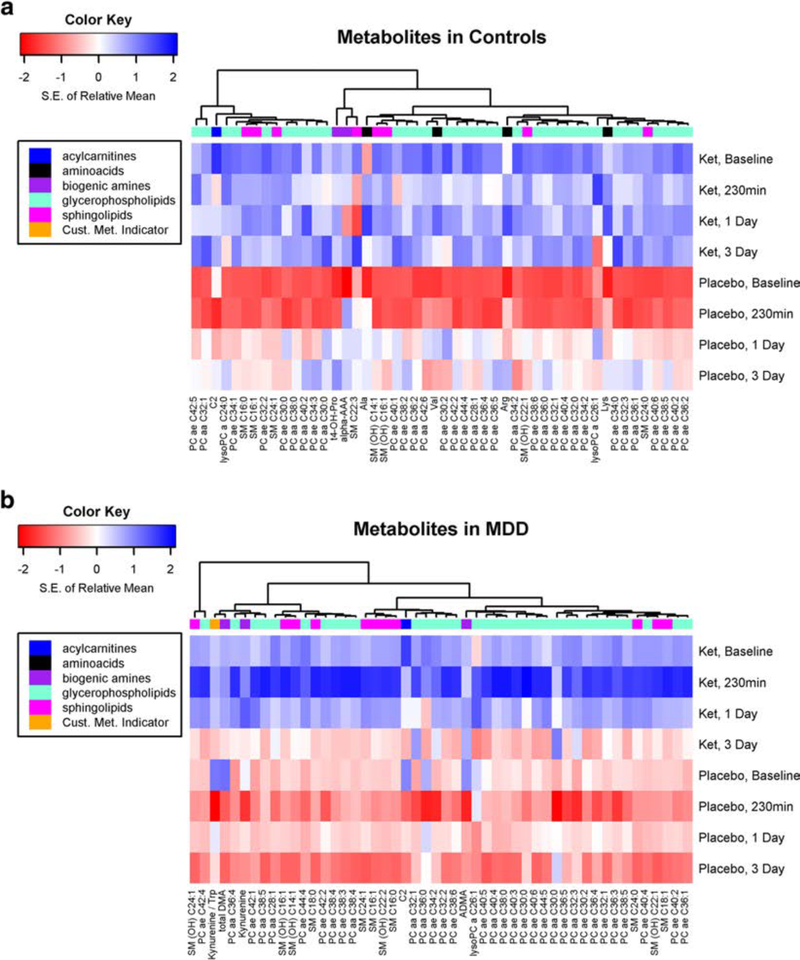
Fig. 1.
a Heat map shows the top 50 most significantly differently changed metabolites between ketamine and placebo over time among healthy controls (without major depressive disorder). Rows indicate standardized mean of log-transformed metabolite by treatment group and time. The dendrogram from hierarchical clustering indicates groups of metabolites with similar treatment and time profiles. b Heat map shows the top 50 most significantly differently changed metabolites between ketamine and placebo over time among participants with major depressive disorder. Rows indicate standardized mean of log-transformed metabolite by treatment group and time. The dendrogram from hierarchical clustering indicates groups of metabolites with similar treatment and time profiles

