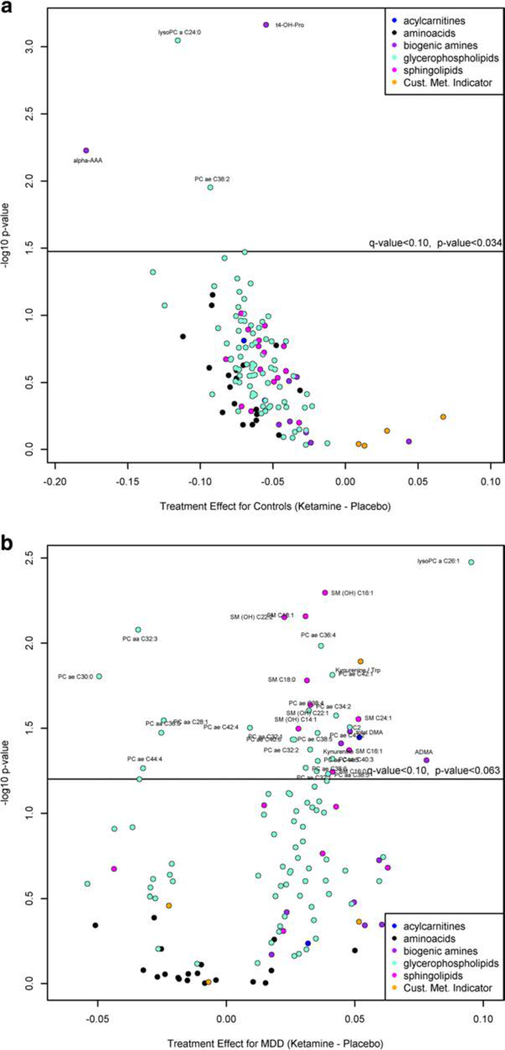
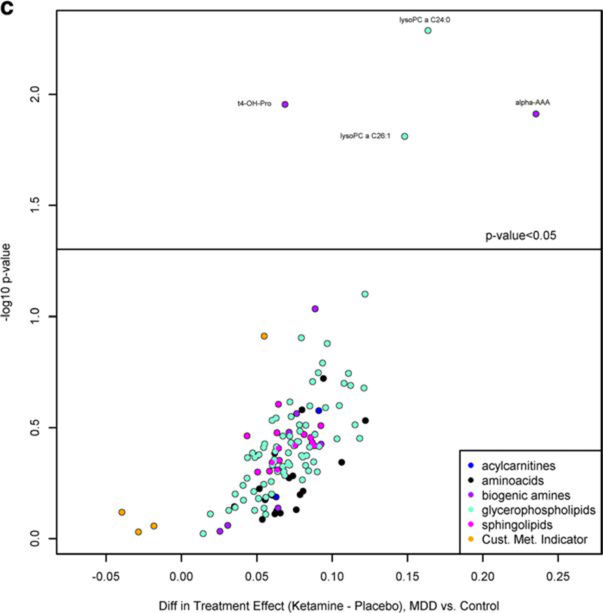
Fig. 2.
Volcano plot for ketamine treatment effect relative to placebo in a healthy controls (q-value < 0.05), b in MDD patients (q-value < 0.10), and c in MDD patients relative to healthy controls (q-value < 0.10). A positive value indicates that either (1) metabolite tended to increase more with ketamine than placebo over time, or (2) metabolite tended to decrease less with ketamine than placebo over time. A negative value indicates either that the metabolite tended to (1) increase less with ketamine than placebo over time, or (2) decrease more with ketamine than placebo over time. The specific pattern can be determined by plotting the time course of the metabolite


