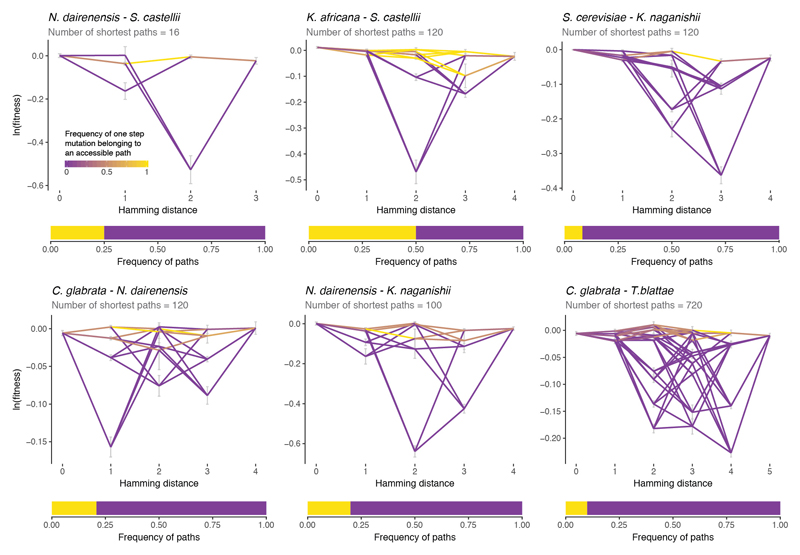
Extended Data Figure 10. Direct paths accessibility between extant species.
Shortest paths between some pairs of extant species (top) together with the proportion of them that are accessible (bottom, yellow = accessible, purple = inaccessible). Nodes are the ln(fitness) of the species genotypes and the intermediate genotypes between them. Edge colours indicate the frequency at which a one step mutation belongs to an accessible path (completely accessible = yellow, completely inaccessible = purple). Error bars are ln(fitness) SEs of each genotype (propagated error from the n = 6 replicates).

