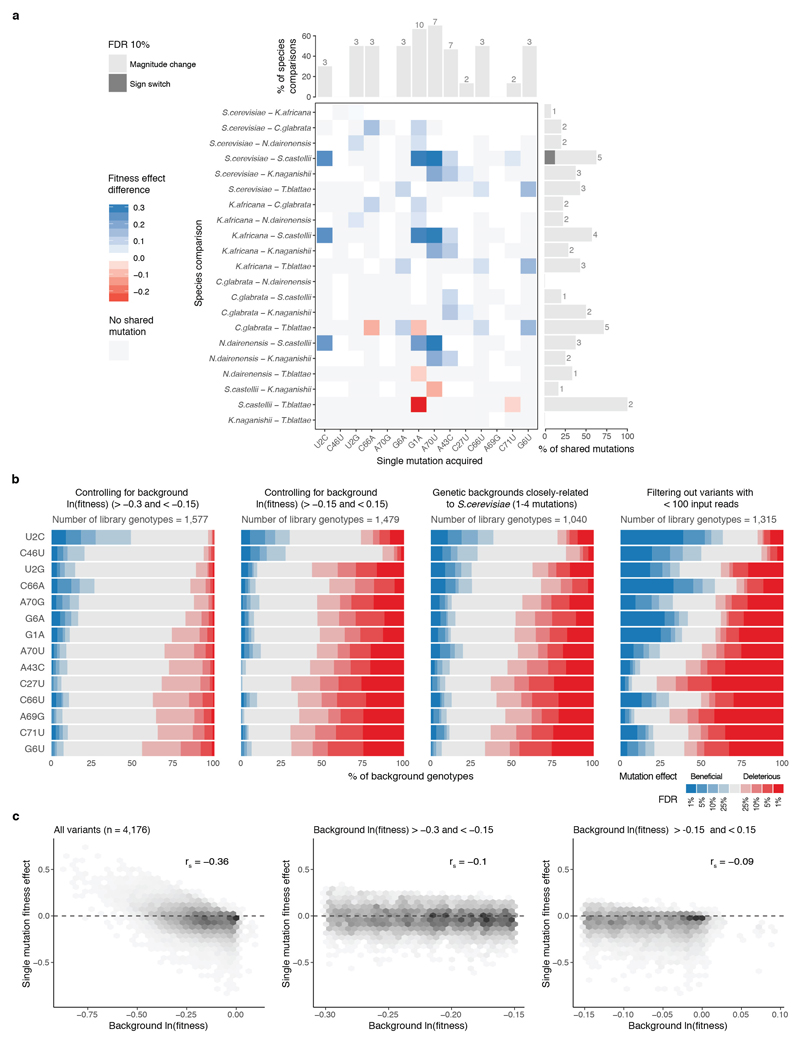
Extended Data Figure 2. Mutations have varying fitness effects in different backgrounds.
a, Single mutations (columns) have effects that differ significantly comparing between genetic backgrounds from different species (rows). Paired two-sided t-test between fitness effects of mutations of tRNAs from different species (145 tests of n = 6). Significant fitness effects differences (FDR<0.1) shown in blue (positive) or red (negative), non-significant differences (FDR>=0.1) coloured in white. Not shared mutations are coloured in grey (i.e. a substitution that would result in a mutation in one species but is part of the ‘wt’ background in another). Bar plots show the % (absolute numbers on top) of species comparisons or shared mutations between species where the effect of the mutation significantly changes in magnitude (light grey) or switches sign (dark grey). b, Proportion of genetic backgrounds in which each mutation has a beneficial (blue) or detrimental (red) fitness effect at different FDRs for backgrounds with ln(fitness) >-0.3 and <-0.15 (left), backgrounds with ln(fitness) >-0.15 and <0.15 (middle left), genotypes with <= 4 mutations from the S. cerevisiae sequence (middle right) and genotypes with average input read counts >= 100 (right,). Q-values were obtained after adjusting for FDR across the total number of single mutations with unique background after filtering (n = 10,746, 6,129, 3,568, 6,338 tests respectively). c, Fitness effect of single mutations plotted against the ln(fitness) of the backgrounds in which the mutation are made; for all genetic backgrounds (left), backgrounds with ln(fitness) >-0.3 and <-0.15 (middle) and backgrounds with ln(fitness) >-0.15 and <0.15 (right). rs = Spearman correlation coefficient.

