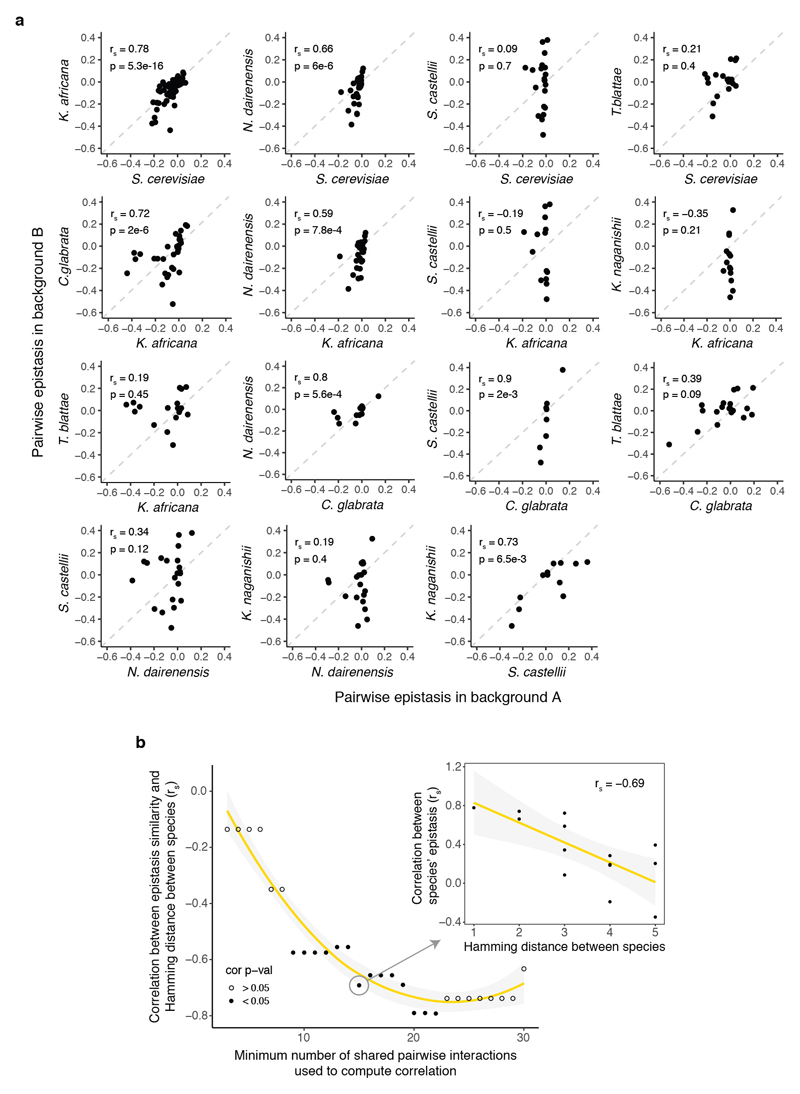
Extended Data Figure 3. Comparison of epistasis scores between all pairs of species.
A, Comparison between epistasis scores of two extant species not shown in Fig 3c. Pairs of species that share less than three mutations are not shown. rs = Spearman correlation coefficient. B, Decline of correlation between epistasis scores and Hamming distance between the tRNA genotypes from different species (right plot, rs = Spearman correlation coefficient). Left plot shows how this negative correlation holds when restricting the minimum number of shared pairs of mutations between the two species to compute the previous.

