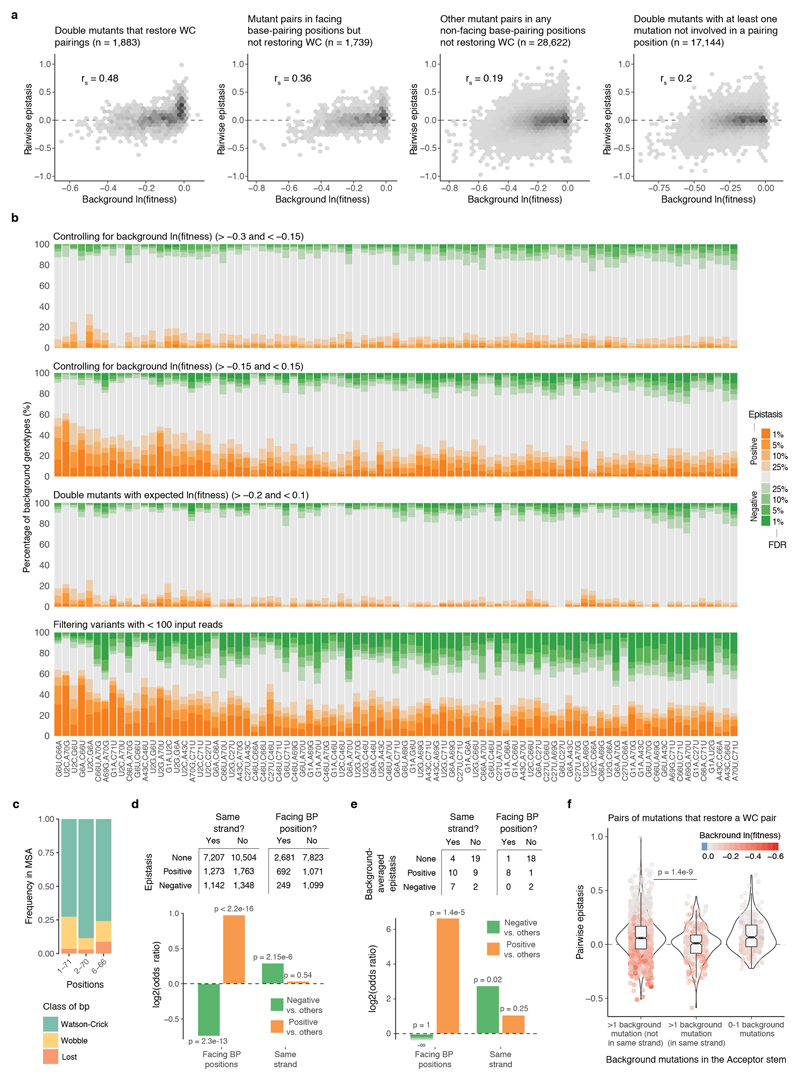
Extended Data Figure 5. Pairwise epistatic interactions switch from positive to negative.
a, Epistasis scores between pairs of mutations plotted against the ln(fitness) of the genetic background. Scatter plots are divided into double mutants that restore Watson-Crick (WC) base pairings (left, n = 1,883), other double mutants where both mutation are in facing bp positions (middle left, n = 1,739), in bp positions but not facing each other (middle right, n = 28,622), and the rest (right, n = 17,144). rs = Spearman correlation coefficient. b, Proportion of genetic backgrounds in which each pair of mutations interacts with positive (orange) or negative (green) epistasis at different FDRs restricted to genetic backgrounds with fitness >-0.3 and <-0.15 (top), with fitness >-0.15 and <0.15 (top middle), with additive expected fitness outcome >-0.2 and <0.1 (middle bottom), or when excluding all genotypes with average input counts <100 (bottom). 23,128, 23,652, 29,628 and 15,306 one sample two-sided t-tests (n = 6). c, A small fraction of Arg-CCU-tRNAs from other eukaryotic species have lost the base pairing in positions 1-71, 2-70 and 6-66 of the tRNA (Multiple sequence alignment, MSA across 1,614 species taken from27; sequences with indels were excluded). d, Number of positive, negative or not significant pairwise interactions at FDR<0.1 within the Acceptor stem of the tRNA (n = 23,237) when both mutations are found in the same helix strand or when each mutation is located in a different strand (n = 13,615). Log2 odds ratio shown below together with two-sided Fisher exact test p-values. e, Number of positive, negative and not significant background-averaged pairwise interactions when pairs of mutations in the Acceptor stem when are found in the same RNA strand, and if not, if mutations are in positions that do base paring with each other. Log2 odds ratio and two-sided Fisher exact test p-values below. f, Distribution of pairwise epistasis values of mutation pairs that restore a canonical WC bp depending on the location of their background mutations in the Acceptor stem (p-values from Welch two-sided t-test, n = 263 and n = 1,368 when >1 background mutations are in the same strand or not, respectively). The same result is obtained when epistasis values are corrected for the ln(fitness) of the background (residuals of a linear model using background ln(fitness) to predict epistasis, data not shown).

