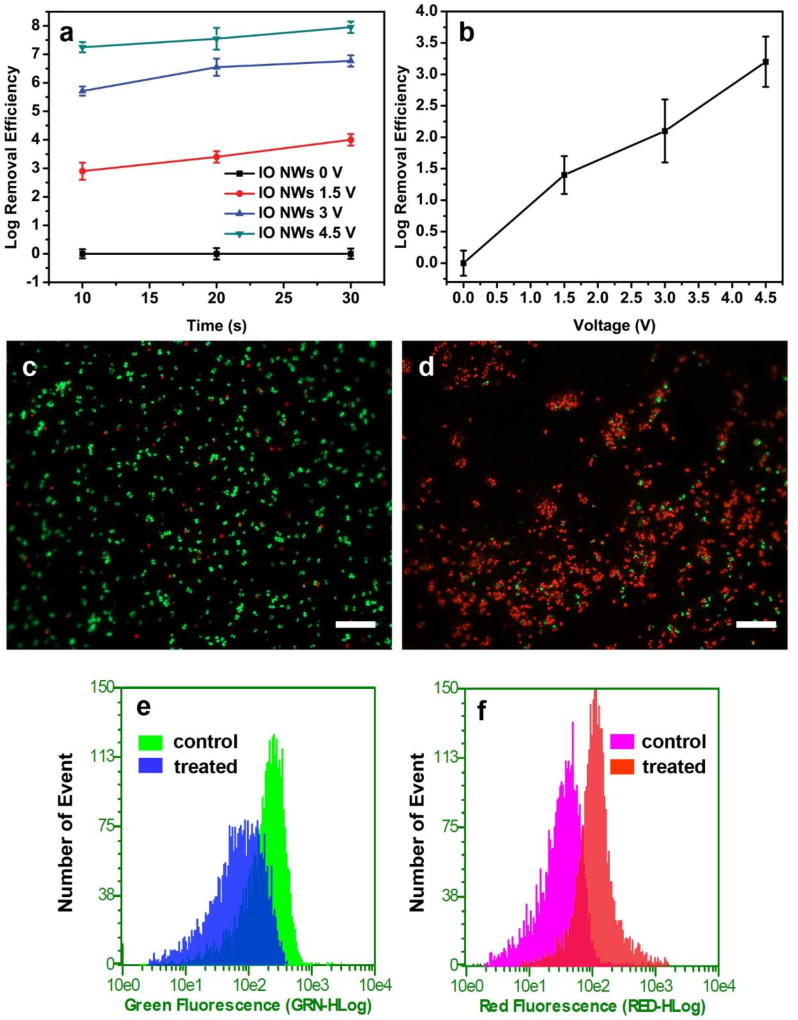
Fig. 2.
(a) Inactivation efficiency of IO NWs filter under different conditions. (b) Control experiments using pristine iron mesh, operation time was 10s. Fluorescence microscope images of S. epidermidis before treatment (control) (c) and after treatment (4.5 V, 10 s) (d). (e) and (f) are the flow cytometry results of samples in (c) and (d). The scale bars in (c) and (d) represent 20 µm.

