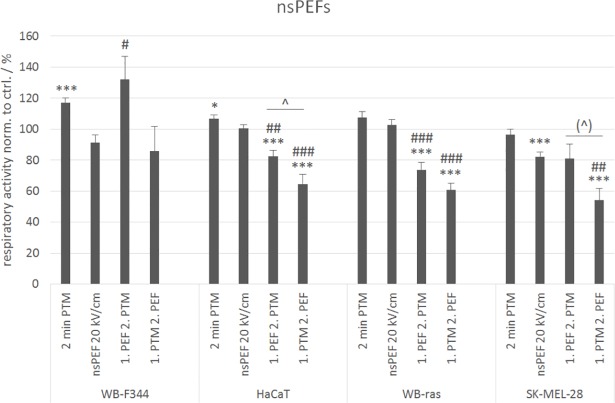
Fig 10. Comparison of the viabilities of WB-F344 and WB-ras cells with the viabilities of HaCaT and SK-MEL-28 cells after treatment with 2-min PTM, nsPEFs (20 kV/cm) or a combination of both, determined 24 h after exposure.
The single treatments are compared to the combined treatments. Significant differences in cell viability are marked for the different treatment methods compared to control (*), for the combined treatments compared to the respective nsPEF-treatment alone (#) and for the two treatment orders (˄). Bars show mean values of three independent experiments performed in triplicates ± standard errors.

