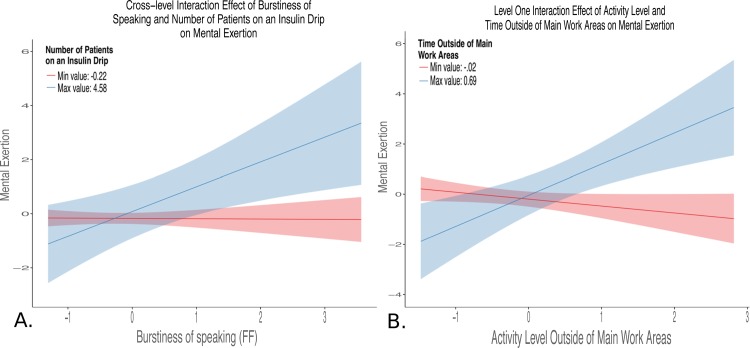
Fig 2. Interaction terms for final reduced mental exertion model.
Blue lines represent the maximum value (upper bound), and red lines indicate the minimum value (lower bound) for the Level 2 variable to illustrate the interaction. The shaded areas around each line indicates the 95% confidence region surrounding the upper and lower bounds moderator variable. Panel A: Cross-level interaction between burstiness of speaking (Level 1 sensor-based measure) and number of patients on an insulin drip (task workload factor) on mental exertion. This illustrates that the task demand of patients on an insulin drip positively moderates the relationship between the burstiness of speaking and mental exertion, such that high levels of burstiness of speaking become more predictive of high levels of mental exertion when caring for patients on an insulin drip. Panel B: Level 1 interaction illustrated that high levels of activity outside of main work areas and longer time outside of main work areas were predictive of high levels of mental exertion.

