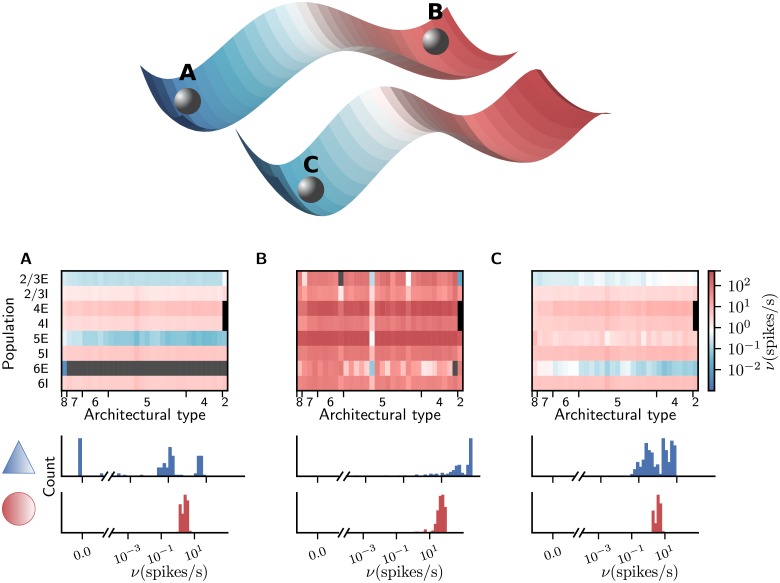
Fig 2. Attractors of the network.
Upper part: Qualitative sketch of the phase space of the network with two stable fixed points, with low and unrealistically high activity, respectively. Modifying the connectivity according to the stabilization procedure of [37] shifts the stable low-activity fixed point towards higher rates without decreasing its global stability. The basins of attractions of the two attractors are divided by the separatrix, a sub-manifold containing one or more unstable fixed points. Lower part, upper panels: firing rates encoded in color. Areas are ordered according to their architectural type along the horizontal axis from V1 (type 8) to TH (type 2) and populations are stacked vertically. The two missing populations 4E and 4I of area TH are marked in black and firing rates < 10-2 spikes/s in gray. The color scale is identical for all three panels. Lower panels: histograms of population-averaged firing rates for excitatory (blue) and inhibitory (red) populations. The horizontal axis is split into linear- (left) and log-scaled (right) ranges. Simulation parameters: (A) g = 16, νext = 10 spikes/s, κ = 1, (B) g = 16, νext = 10 spikes/s, κ = 1.125, (C) g = 11, νext = 10 spikes/s, κ = 1.125 with the modified connectivity.

