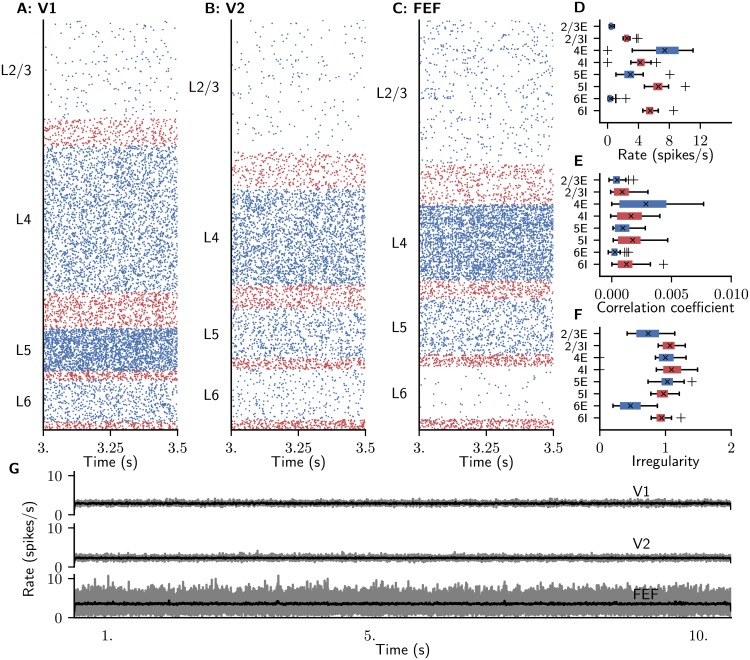
Fig 3. Ground state of the model.
(A-C) Raster plot of spiking activity of 3% of the neurons in area V1 (A), V2 (B), and FEF (C). Blue: excitatory neurons, red: inhibitory neurons. (D-F) Spiking statistics across all 32 areas for the respective populations shown as area-averaged box plots. Crosses: medians, boxes: interquartile range (IQR), whiskers extend to the most extreme observations within 1.5×IQR beyond the IQR. (D) Population-averaged firing rates. (E) Average pairwise correlation coefficients of spiking activity. (F) Irregularity measured by revised local variation LvR [82] averaged across neurons. (G) Area-averaged firing rates, shown as raw binned spike histograms with 1 ms bin width (gray) and convolved histograms, with a Gaussian kernel (black) of optimal width [80].

