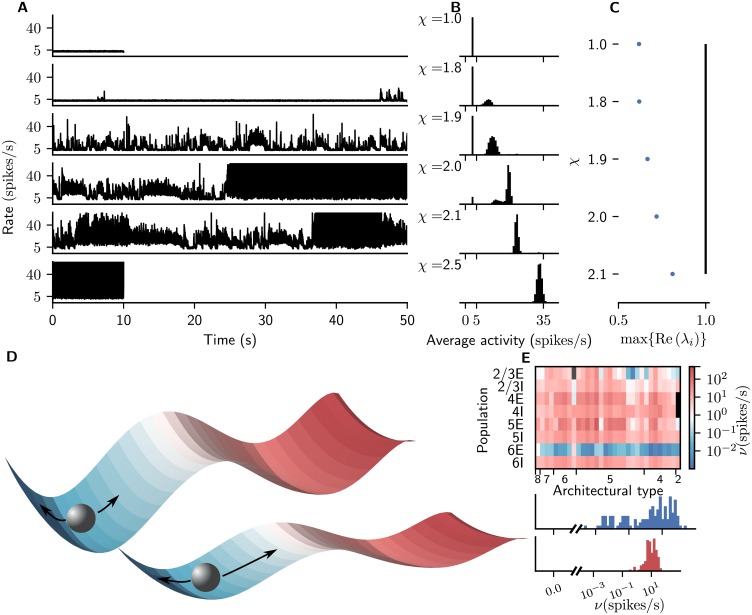
Fig 4. Emergence of metastable network dynamics.
(A) Time course of spike rates averaged across all neurons in area V1 for increasing χ (graphs from top to bottom). Cortico-cortical synaptic weights onto inhibitory cells are additionally scaled by for χ > 1. (B) Histogram of analytically computed population firing rates resulting from 104 random initial conditions of Eq (2) for same χ as in (A) averaged across all populations of the network. (C) Real part of maximal eigenvalue of the effective connectivity matrix (Eq (3)) for different values of χ. The values stay below 1 for χ ≤ 2.1, i.e., the network stays locally stable. The increasing proportion of initial conditions in panel B leading to the high-activity fixed point shows that at the same time, the global stability of the low-activity fixed point is reduced. (D) Sketch of the network phase space consisting of two stable fixed points and a submanifold with unstable fixed points separating the two basins of attraction (color indicates spike rate). The network activity (gray sphere) fluctuates around the low-activity fixed point (top). For increasing χ (bottom), the network approaches the separatrix, where the fluctuations become slow. If they are large enough, the network state can pass the separatrix and undergo a transition to the high-activity fixed point. (E) Population-resolved firing rates for χ = 1.9. Same display as in Fig 2.

