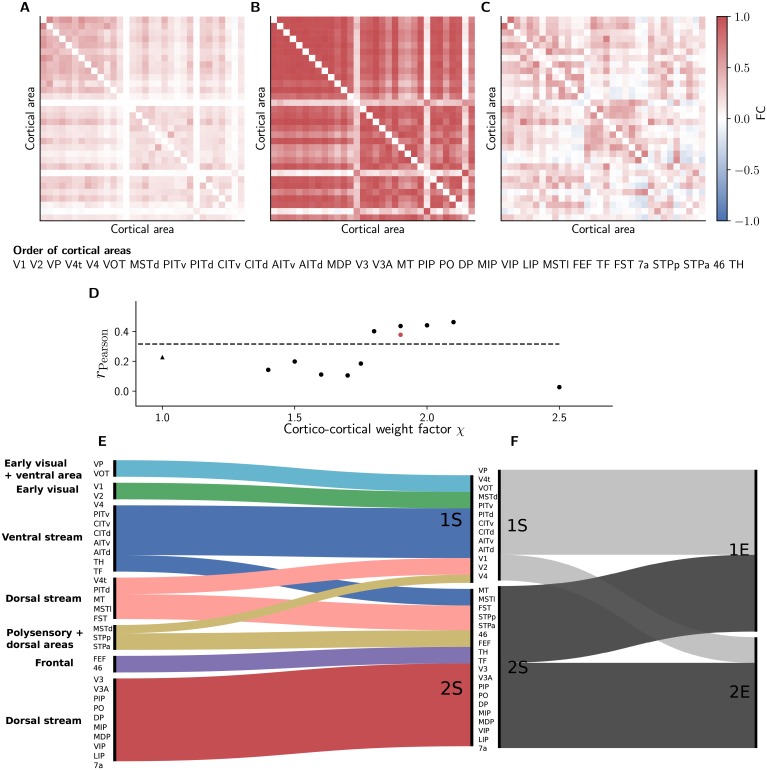
Fig 8. Inter-area interactions.
(A) Simulated functional connectivity (FC) for χ = 1.9 measured by the zero-time-lag correlation coefficient of synaptic input currents. (B) Functional connectivity obtained by applying the Balloon model of [94] to the simulated synaptic input currents. (C) FC of macaque resting-state fMRI (see Materials and methods). The matrix elements are sorted according to simulated clusters determined with the Louvain algorithm [112] (see Materials and methods). (D) Pearson correlation coefficient of simulated FC vs. experimentally measured FC as a function of scaling factor χ for cortico-cortical synaptic weights with (dots) and (triangle, cf. Fig 3). Red dot, Pearson correlation coefficient between simulated FC based on BOLD signal and experimentally measured FC. Dashed line, Pearson correlation coefficient of structural connectivity vs. experimentally measured FC. Bottom row: Alluvial diagrams [113] showing (colors distinguish clusters) the differences in the clusters for the structural connectivity and the simulated FC (E), and simulated and experimentally measured FC (F). The clusters of the structural connectivity are extracted using the map equation method [98].

