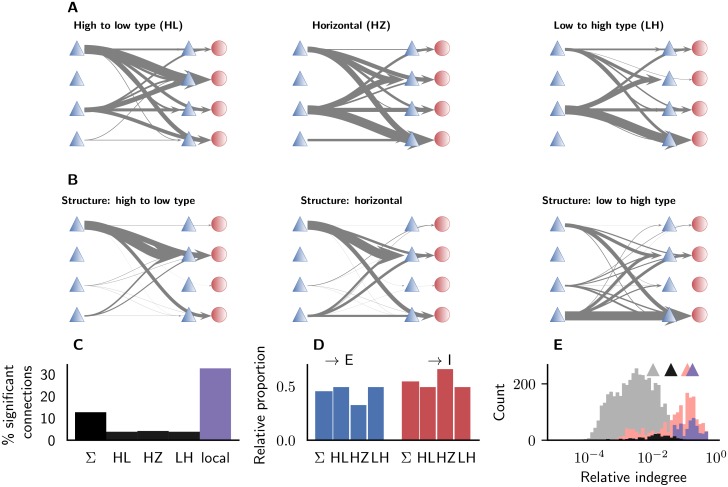
Fig 9. Laminar interactions.
(A) Significant causal interactions between all pairs of areas categorized according to the difference between their architectural types. Arrow thickness indicates the occurrence of significant interactions (p < 0.05, Levene’s test) between the particular populations (cell types and layers displayed as in Fig 1). (B) Population-specific patterns of shortest paths between all pairs of areas. (C) Proportion of significant connections for the three categories and local connections. (D) Proportion of significant impact onto excitatory and inhibitory populations, respectively, for the three different categories. Σ indicates the respective value over all connections. (E) Histogram of relative indegrees. Bars show data for all (light gray) and significant (black) cortico-cortical connections; and for all (pink) and significant (purple) local connections. The triangles indicate the mean values of the four distributions.

