Fig 5.
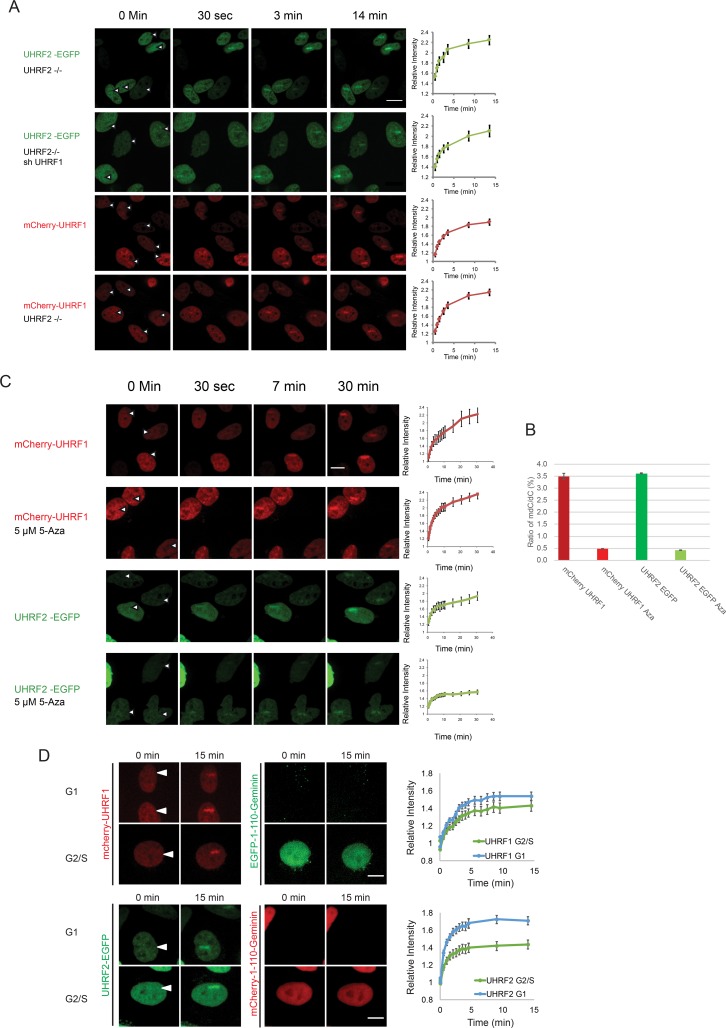
A) UHRF1 and UHRF2 are recruited to ICLs in vivo independently of each other. HeLa cells expressing either EGFP-tagged UHRF2 or mCherry-tagged UHRF1, were depleted of endogenous UHRF2 (CRISPR/Cas-9) and/or UHRF1 (shRNA). The cells were pre-treated with TMP and then microirradiated at the indicated sites. Charts indicate quantification of relative intensity of signal at the irradiated sites. Error bars show SEM n = 8/treatment. B) Genomic DNA from cells in (C) was assessed for the degree of DNA methylation. The percent of methylated cytosines vs. non-methylated cytosines is shown for each treatment. C) Cells expressing mCherry-tagged UHRF1 or EGFP-tagged UHRF2 were subjected to 5 μM 5-Aza-2'-deoxycytidine for 5 days. Cells were pre-treated with TMP and microirradiated at the sites indicated by the white arrows. The charts show the quantification of the stripe intensity. Error bars show SEM, n = 8 per treatment. The p-value for UHRF2 Aza compared to control UHRF2 is 0.005. D) Cells expressing either UHRF1-mCherry and EGFP-1-110-Geminin, or, UHRF2-EGFP and mCherry-1-110-Geminin, were imaged for 15 after the introduction of ICLs by microirradiation following treatment with TMP. The intensity of the fluorescent proteins in the microirradiated areas were quantified and plotted, in either G1 or S/G2-phase cells. Representative images shown. Error is shown as SEM, n = 16 per fluorophore. Scale bar indicates 10μm.

