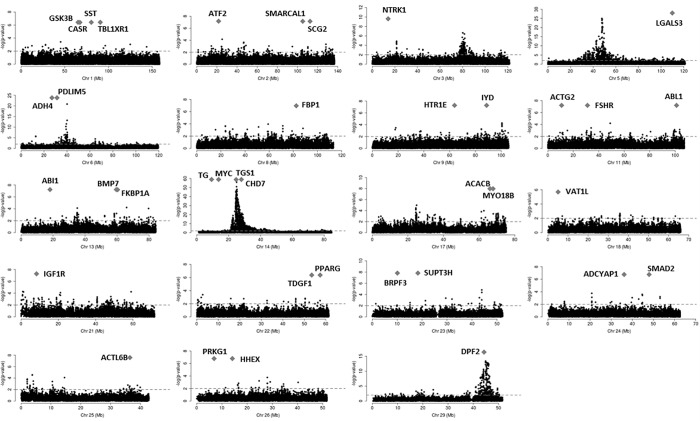
Fig 6. Chromosome specific plots displaying pleiotropic effect around the genes shared among all breeds.
The x-axis corresponds to the genomic position in each chromosome and the y-axis to the -log(p-value). The -log(p-value) showed in the y-axis corresponds to the p-values adjusted to multiple-testing (FDR<0.01) obtained by Bolormaa et al. (2014) [10] for the pleiotropic analysis. The grey diamond corresponds to the start coordinate of each gene. The horizontal dashed lines indicate the nominal threshold of -log(p-value)>2. All the genes mapped in an interval of 1 Mb of a marker with significant signal for pleiotropic effect were considered as a genes in pleiotropic regions.

