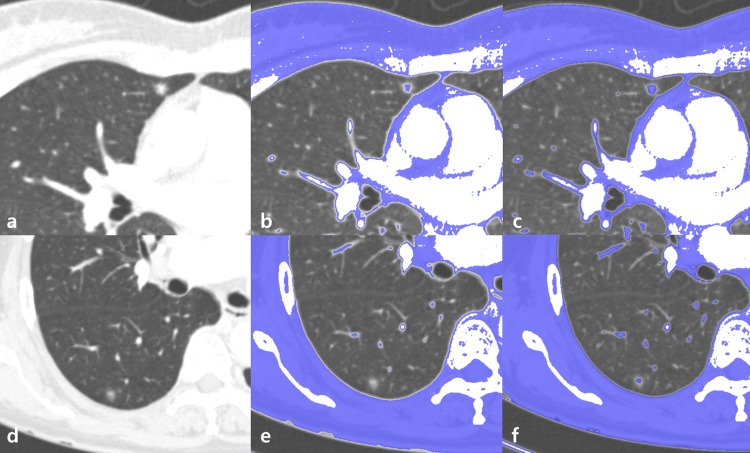
Fig 1. Different subcategorization of ground-glass opacity nodules (GGNs) according to different thresholds: Classifying GGN according to two thresholds.
(a) Axial computed tomography (CT) image revealing GGN in the right middle lobe. (b) Axial CT images demonstrating areas above the high threshold (-160 Hounsfield units [HU]) (blue area). The GGN is identified as a part-solid GGN with a solid portion inside. (c) Axial CT images demonstrating areas above the low threshold (-400 HU) (blue area). The GGN is identified as a part-solid GGN with a solid portion inside. (d) Axial CT image demonstrating another GGN in the right lower lobe. (e) Axial CT images demonstrating areas above the high threshold (-160 HU) (blue area). The GGN is identified as a pure GGN without a solid portion inside. (f) Axial CT images demonstrating areas above the low threshold (-400 HU) (blue area). The GGN is identified as a part-solid GGN with a solid portion inside. As a result, the GGN in (a) is a part-solid GGN in both thresholds, whereas the GGN in (d) is a pure GGN in high threshold and part solid GGN in low threshold.

