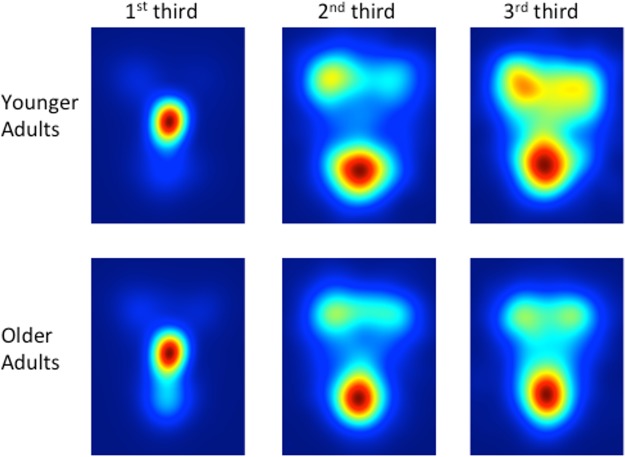
Fig 3. Exploration heat maps showing location of exploration time as a function of age group and time course (1st third, 2nd third, 3rd third) of the exploration session.
Data are pooled across all emotions, since the ROI analysis did not reveal any interactions between age and emotion. Mouse exploration data (x,y) were weighted by exploration time and smoothed with a 48-pixel Gaussian filter. Each individual heat map is scaled from zero time (blue) to the point of maximal exploration time (red).

