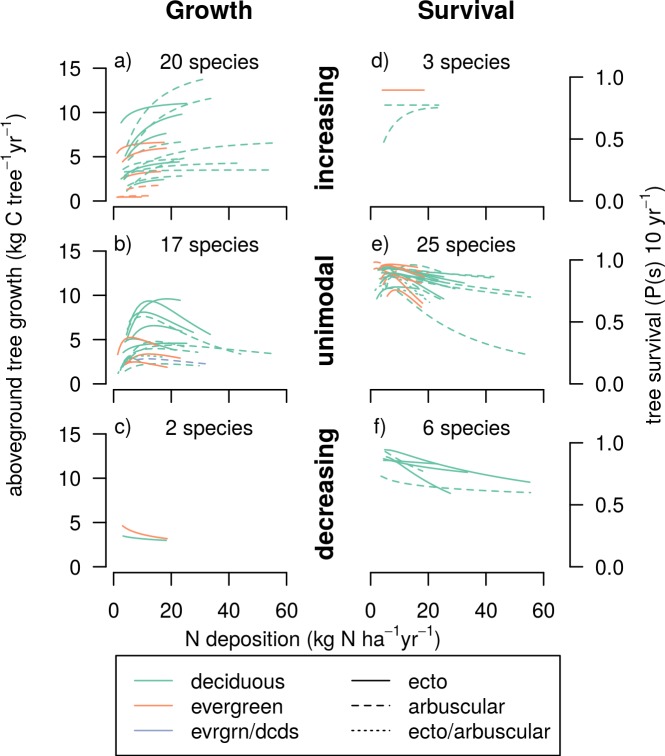
Fig 2. Tree growth and survival versus N deposition by species and colored by ecological attributes.
Each curve represents the average tree growth (a-c) or survival (d-f) across the N deposition gradient for a single species. The relationships are separated by general curve shape; The (a,d) increasing, (b,e) unimodal, and (c,f) decreasing relationships with N deposition are shown. (For individual species and growth and survival curves by species and the curves associated with S deposition see S1 Fig). Note that two of the five species in panel d are functionally flat (< 0.01% change over deposition range) and are classified as flat in Table 1.

