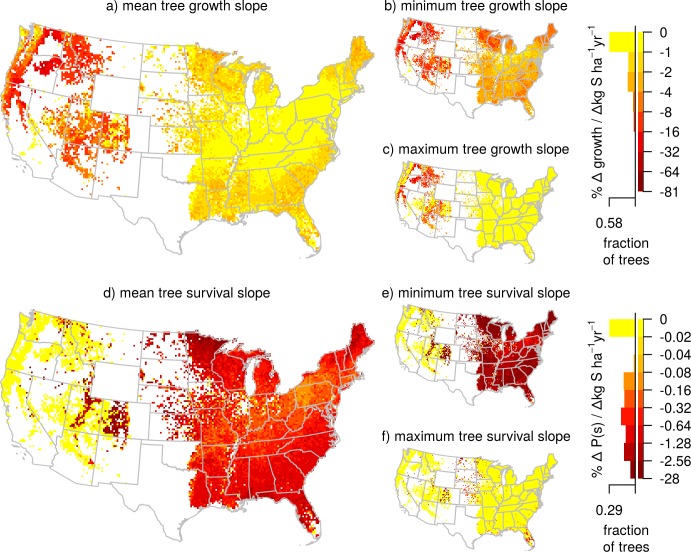
Fig 4.
Relative change in growth and survival with S deposition of individual trees across the conterminous U.S. Maps show the relative mean, minimum, and maximum growth (a-c) and survival (d-f) responsiveness (percent change in growth or survival per change in annual S deposition rate) of trees within each 20 x 20 km pixel. Values were derived from the instantaneous rate of change in growth or survival with S deposition of the most parsimonious, species-specific models that allowed both N and S deposition (but did not necessarily contain N or S deposition). Red areas indicate where small increases in S deposition are associated with relatively large decreases in growth or survival. White areas are where no tree growth or survival data were available. Histograms indicate the fraction of individual trees by responsiveness to N deposition. Sample size for growth was 1,183,931 trees and for survival was 1,423,455 trees.

