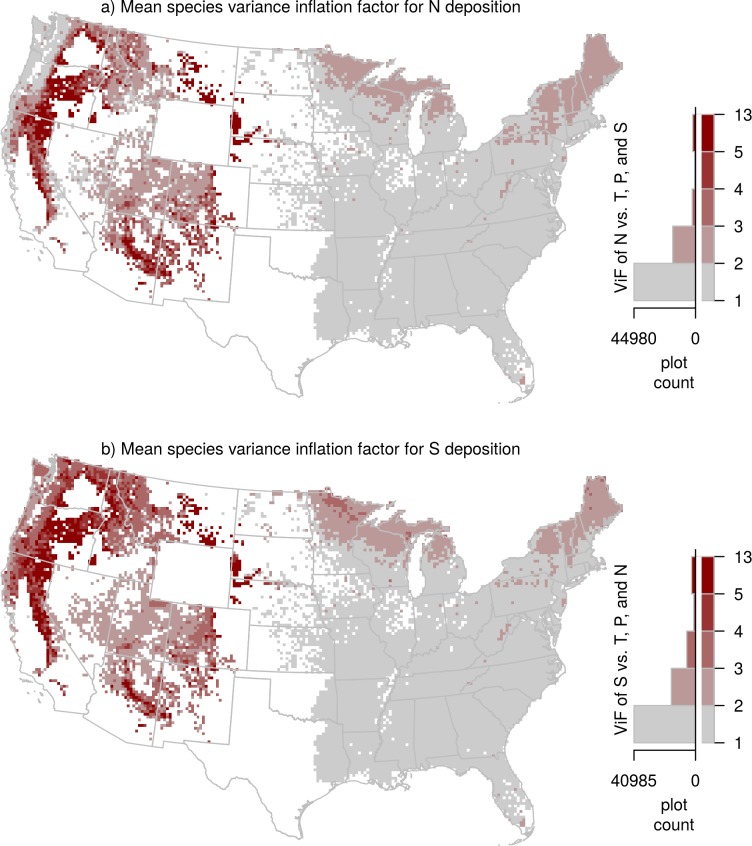
Fig 5.
Spatial map of variance inflation factors (VIF): (a) VIF of the relationship between nitrogen (N) deposition and mean annual, temperature, mean annual precipitation, and sulfur (S) deposition; (b) VIF of the relationship between S deposition and mean annual, temperature, mean annual precipitation, and N deposition. VIF for N and S deposition was calculated for each of the 94 tree species, assigned to each tree in the FIA inventory based on species identity, and averaged across inventoried trees in each 20 x 20 pixel. Higher VIF values correspond to regions where the species present in the grid-cell have stronger covariation among predicters in the growth and survival models.

