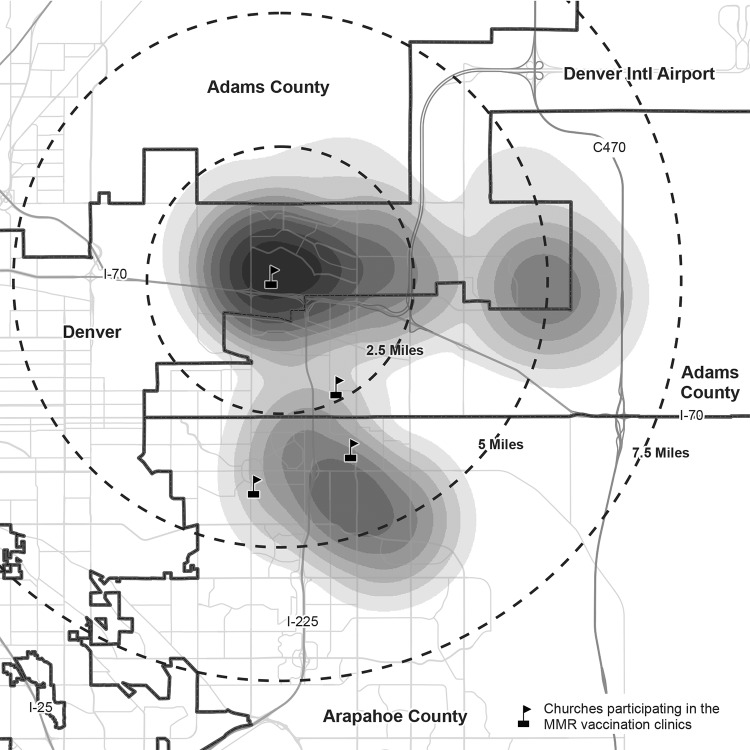
FIGURE 2.
Geographic density* of outbreak mumps cases (n = 46),† by geocoded residential address§ and location of measles-mumps-rubella vaccination clinics held during the public health response — Colorado, 2016–2017
* Gradient indicates the relative number of cases; darkest shading indicates highest density.
† One outbreak case occurred in a patient who was geographically isolated from all other cases and was suppressed from the calculation of the density surface to protect patient privacy.
§ Density surface is calculated by a kernel density function using the geocoded residential addresses of confirmed mumps cases.

