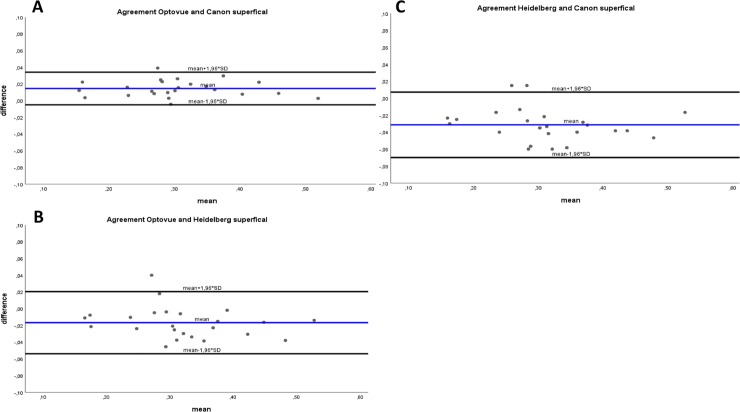
Fig 3.
A–C. Bland-Altman-analysis. Bland-Altman plots showing the level of agreement for the area of the FAZ in the superficial retinal OCT-A angiogram. A: Optovue and Canon; B: Optovue and Heidelberg; C: Heidelberg and Canon. Broken line represents the mean difference; dotted lines represent the limits of agreement.

